记录一次OOM的排查过程
需求:写一个程序手动设置占用内存大小,代码如下
import java.util.ArrayList;
import java.util.List;public class ResourceHog {public static void main(String[] args) {if (args.length < 2) {System.out.println("Usage: java ResourceHog <cpuThreads> <memoryMB>");System.out.println("Example: java ResourceHog 4 500");return;}int allCpuCount = Runtime.getRuntime().availableProcessors(); // cpu的数量System.out.println("allCpuCount:" + allCpuCount);int cpuThreads = Integer.parseInt(args[0]); // 占用 CPU 比例cpuThreads = (int) (allCpuCount * (cpuThreads / 100.0));System.out.println("cpuThreadsCount:" + cpuThreads);int memoryMB = Integer.parseInt(args[1]);  // 占用的内存大小(GB)// 启动占用 CPU 的线程for (int i = 0; i < cpuThreads; i++) {new Thread(() -> {while (true) {Math.pow(Math.random(), Math.random()); // 模拟高 CPU 计算}
//                while (true) {
//                    for (int j = 0; j < Integer.MAX_VALUE; j++) {
//                        Math.sqrt(j);
//                    }
//                }}).start();}long maxMemory = Runtime.getRuntime().maxMemory() / (1024 * 1024); // 最大堆内存long totalMemory = Runtime.getRuntime().totalMemory() / (1024 * 1024); // 当前堆内存long freeMemory = Runtime.getRuntime().freeMemory() / (1024 * 1024); // 空闲堆内存System.out.println("Max Heap Memory: " + maxMemory + " MB");System.out.println("Total Heap Memory: " + totalMemory + " MB");System.out.println("Free Heap Memory: " + freeMemory + " MB");// 启动占用内存的线程long[] memoryHog = new long[memoryMB * 1024 * 1024 * 128]; // 每次分配 1GSystem.out.println("Resource hogging started. Check your system performance.");}
} 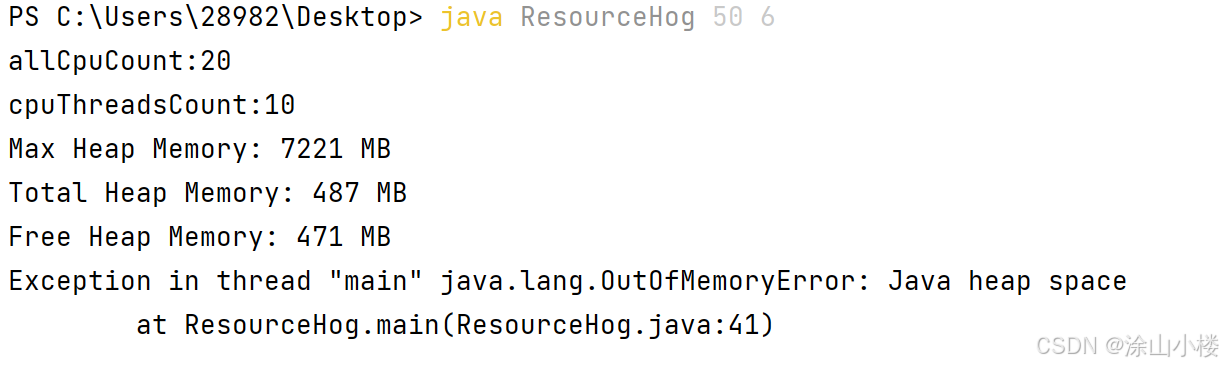
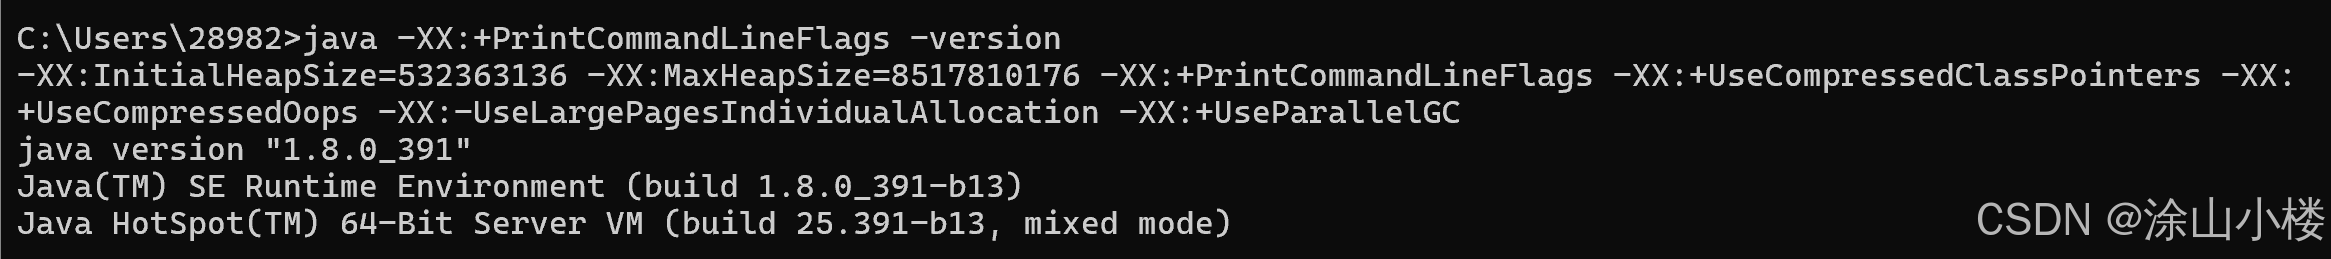
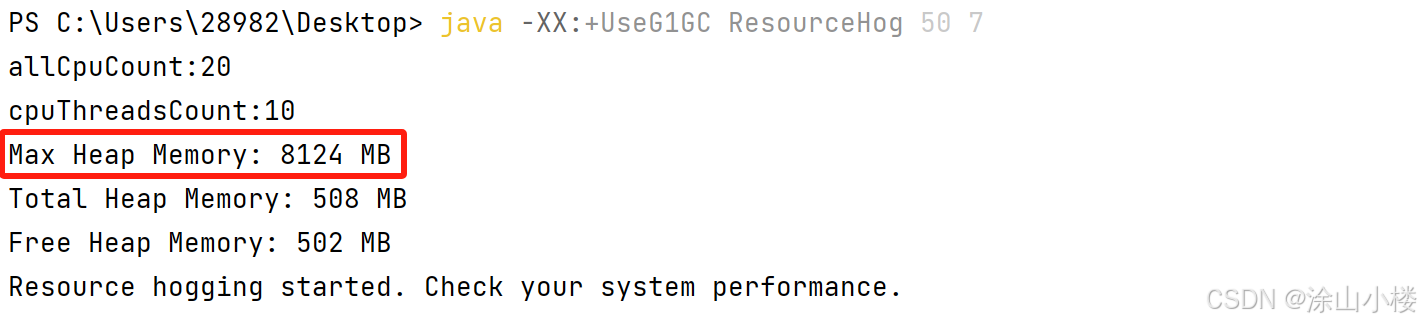
通过程序以及java命令打印最大堆内存都是超过7个G的,大约是物理内存的4分之一,所以我能分配的内存不能超过8个G,但是实际使用过程中发现当我内存分配到6个G的时候就会触发OOM,百思不得其解。后来研究发现,是堆内存碎片化导致,然后手动使用G1垃圾回收器,就可以分配到7个G内存,问题解决!而且使用G1垃圾回收器,最大可使用内存更接近实际最大可使用内存,如我红框标注

堆内存碎片化
即使堆内存总量足够,但由于内存碎片化,无法找到一个连续的内存块来满足分配请求,也会触发OOM。
解决方法:
- 调整垃圾回收器的策略,减少碎片化。例如,使用 G1 垃圾回收器:
java -XX:+UseG1GC -Xmx<size> -Xms<size> ResourceHog
终上:java -XX:+UseG1GC -Xmx10g -Xms10g ResourceHog 50 9,该命令可以随心所欲的设置占用内存,但是分配的内存比要占用的内存大一点,因为程序本身也是占用内存的,故分配10G,数组占用9G。