Title
题目
Tumor evolution metrics predict recurrence beyond 10 years in locally advanced prostate cancer
肿瘤演变指标预测局部晚期前列腺癌10年以上的复发
01
文献速递介绍
癌症演变为预测肿瘤学奠定了基础。测试进化指标需要在控制临床试验中进行定量测量。我们使用来自114名参与临床试验的个体的642个样本,对局部晚期前列腺癌的基因组内肿瘤异质性进行了映射,随访中位数为12年。我们还使用深度学习评估了250名个体的1923个组织学切片的形态学异质性。基因和形态(Gleason)多样性是独立的复发预测指标(危险比(HR)= 3.12,95%置信区间(CI)= 1.34–7.3;HR = 2.24,95% CI = 1.28–3.92)。结合这些指标,可以识别出中位复发时间减半的群体。克隆的空间分离也是复发的独立标志(HR = 2.3,95% CI = 1.11–4.8)。我们发现与Gleason等级相关的拷贝数变化,并发现染色体6p丢失与免疫浸润减少相关。几十年后诊断复发的匹配分析证实了基因组不稳定性是前列腺癌进展的驱动力。本研究表明,将基因组学与人工智能辅助的组织病理学相结合,可以识别出肿瘤演变的临床生物标志物。
Method
方法
All research was performed in accordance with local and national ethical standards, and the study protocol was approved by the West of Scotland Research Ethics Service in December 2017 (HRA ID 230542). The research was performed at the Institute of Cancer Research, London.
所有研究均按照当地和国家的伦理标准进行,研究方案于2017年12月获得西苏格兰研究伦理服务的批准(HRA ID 230542)。研究在伦敦癌症研究所进行。
Results
结果
The IMRT clinical trial (NCT00946543) recruited 471 individuals who received neoadjuvant/adjuvant ADT and intensity-modulated radiotherapy to the prostate and pelvic lymph nodes, as per the trial guidelines19, which represents the current standard of care for radiation treatment of prostate cancer20–22. Enrolled individuals were considered high or very high risk according to National Comprehensive Cancer Network guidelines, with a previously reported recurrence rate of 40%. Six to 12 multiregion, spatially separated formalin-fixed paraffin-embedded (FFPE) needle biopsies were available per participant (Fig. 1a). Independent of the original clinical assessment, pathology was also reviewed on a core-by-core basis by a single specialist uropathologist (C.M.C.).
IMRT临床试验(NCT00946543)招募了471名个体,这些个体根据试验指南接受了新辅助/辅助ADT和前列腺及骨盆淋巴结的强度调制放射治疗,这代表了当前前列腺癌放射治疗的标准护理。根据国家综合癌症网络指南,入选的个体被认为是高风险或极高风险,先前报道的复发率为40%。每位参与者都有6到12个多区域、空间分离的福尔马林固定石蜡包埋(FFPE)针刺活检样本(图1a)。独立于原始临床评估,病理学也由一名专业的泌尿病理学家(C.M.C.)逐个核心地进行审查。
Figure
图
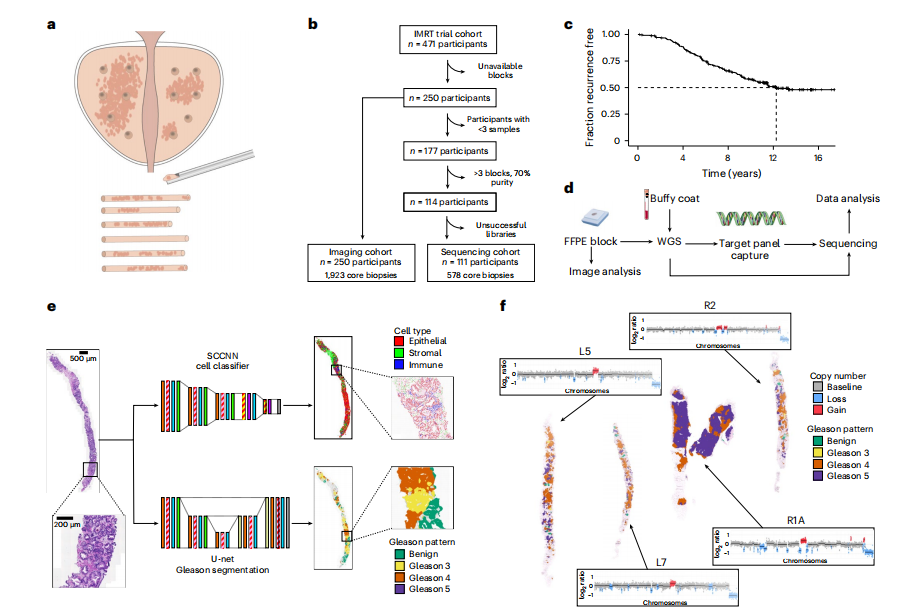
Fig. 1 | Study design. a, Within the IMRT clinical trial (NCT00946543), 6–12 ultrasound-guided diagnostic needle biopsies were taken per individual for routine diagnosis and were embedded in paraffin. b, Decision tree for the imaging cohort (n = 250 individuals, n = 1,923 biopsies) and sequencing cohort (n = 111 individuals, n = 578 biopsies). The DELINEATE trial cohort was not included. c, Kaplan–Meier curve for time to recurrence in the imaging cohort (n = 250 individuals). d, Experimental workflow for FFPE biopsies and matched germline (buffy coat/normal FFPE tissue). Figure created with BioRender.com. e, Computational histopathology analysis with deep learning both for Gleason segmentation and single-cell classification on H&E sections. Sample input and output is shown for FI-115-S8; SCCNN, spatially constrained convolutional neural network. f, Example of individual FI-132, where computational Gleason segmentation and CNA genomic data were compared.
图1 | 研究设计。a, 在IMRT临床试验(NCT00946543)中,每个个体进行了6-12次超声引导的诊断性针刺活检用于常规诊断,并嵌入石蜡中。b, 成像队列(n = 250人,n = 1,923次活检)和测序队列(n = 111人,n = 578次活检)的决策树。DELINEATE试验队列未被包括在内。c, 成像队列(n = 250人)的复发时间Kaplan-Meier曲线。d, FFPE活检样本和匹配的生殖系(白细胞层/正常FFPE组织)的实验工作流程。图像使用BioRender.com创建。e, 使用深度学习进行Gleason分割和H&E切片上的单细胞分类的计算病理分析。显示了FI-115-S8的样本输入和输出;SCCNN,空间约束卷积神经网络。f, 个人FI-132的示例,比较了计算Gleason分割和CNA基因组数据。
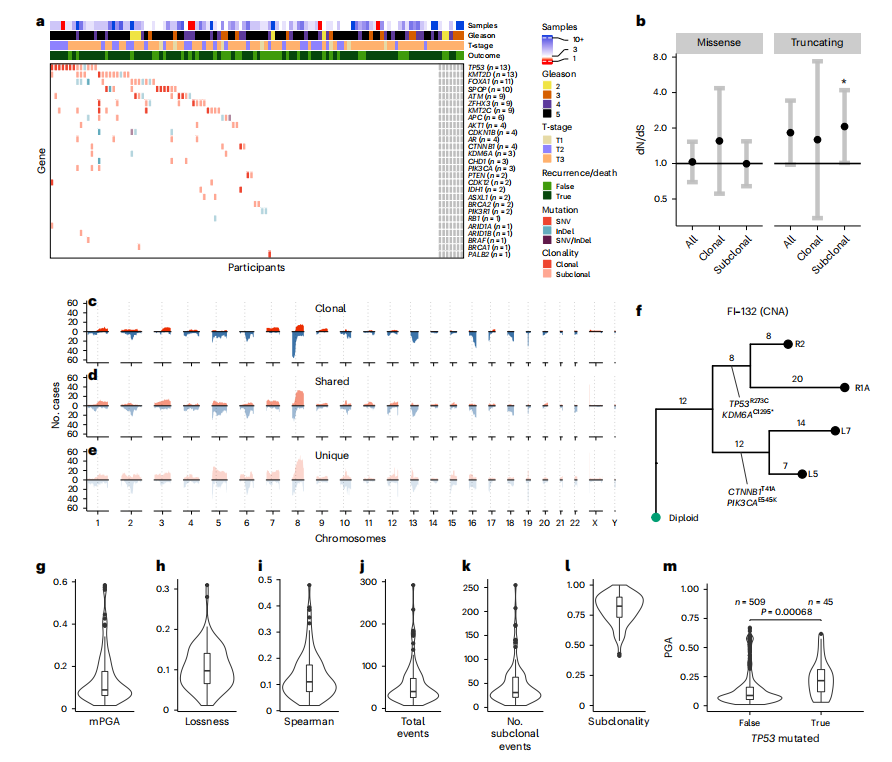
Fig. 2 | Genetic intratumor heterogeneity landscape of locally advanced prostate cancer. a, Heat map representing the mutational landscape of the cohort (*n = 114 participants), including number of low-pass WGS samples with detected CNAs, ISUP grade group (reviewing pathologist for IMRT participants, original specialist uropathologist S. Hazell (Royal Marsden NHS Foundation Trust) for DELINEATE, where participants were not reviewed), T-stage and recurrence/death status. Mutations are colored and shaded by their type (SNV and insertion/deletion (InDel)) and clonality status (clonal/subclonal). b, dN/dS analysis of all mutations using dNdScv for missense and truncating mutations shows subclonal truncating mutations to be under positive selection. Clonal and subclonal mutations were taken only from participants with three or more targeted sequencing samples (all n = 107 participants, clonal/subclonal n = 98 participants). Intervals represent 95% CI, and the centers represent the maximum likelihood estimate. c–e, CNA landscape of prostate cancer defined by phylogenetic status per case. Gains (red) and losses (blue) are represented relative to ploidy of the samples (n = 111 participants). f, An example of MEDICC2-inferred CNA phylogeny in FI-132 with manually annotated driver SNVs. g–l, Genomic metrics of genomic instability and heterogeneity were calculated before outcome unblinding (n = 109 participants, sequencing cohort participants with three or more samples with a PGA of ≥0.01). m, TP53-mutant samples presented with significantly higher PGA (linear mixed effects model, two-sided t-test on gradient, s.e. = 0.02, d.f. = 552, t = 3.4, samples with a PGA of ≥0.01, n = 554 samples). Box plots show the center line as the median and box limits as upper and lower quartiles. Whiskers extend no further than 1.5× the interquartile range past the box limits, and points represent outliers.
图2 | 局部晚期前列腺癌的基因组内肿瘤异质性景观。a, 热图展示了该队列(n = 114名参与者)的突变景观,包括低通量全基因组测序样本中检测到的拷贝数变异(CNA)数量、ISUP等级组(IMRT参与者的审查病理学家,DELINEATE的原专业泌尿病理学家S. Hazell(皇家马斯登NHS基金会信托基金会)未审查的参与者)、T期和复发/死亡状态。突变按类型(SNV和插入/缺失(InDel))和克隆状态(克隆/亚克隆)进行着色和阴影处理。b, 使用dNdScv对所有突变进行的dN/dS分析显示,亚克隆截断突变处于正选择之下。克隆和亚克隆突变仅来自具有三个或更多目标测序样本的参与者(所有* n* = 107名参与者,克隆/亚克隆n = 98名参与者)。区间表示95%置信区间,中心表示最大似然估计。c–e, 前列腺癌的CNA景观按每个病例的系统发育状态定义。相对于样本的倍性,增益(红色)和丧失(蓝色)被表示出来(n = 111名参与者)。f, MEDICC2推断的FI-132中具有手动注释驱动SNV的CNA系统发育的示例。g–l, 在揭盲结果前计算的基因组不稳定性和异质性的基因组指标(n = 109名参与者,测序队列中具有三个或更多样本且PGA ≥0.01的参与者)。m, TP53突变样本呈现出显著更高的PGA(线性混合效应模型,对梯度进行双侧t检验,标准误差=0.02,自由度=552,t=3.4,PGA≥0.01的样本,n = 554个样本)。箱线图显示中心线为中位数,箱体边界为上四分位数和下四分位数。须线延伸不超过箱体边界1.5倍的四分位距,点表示离群值。
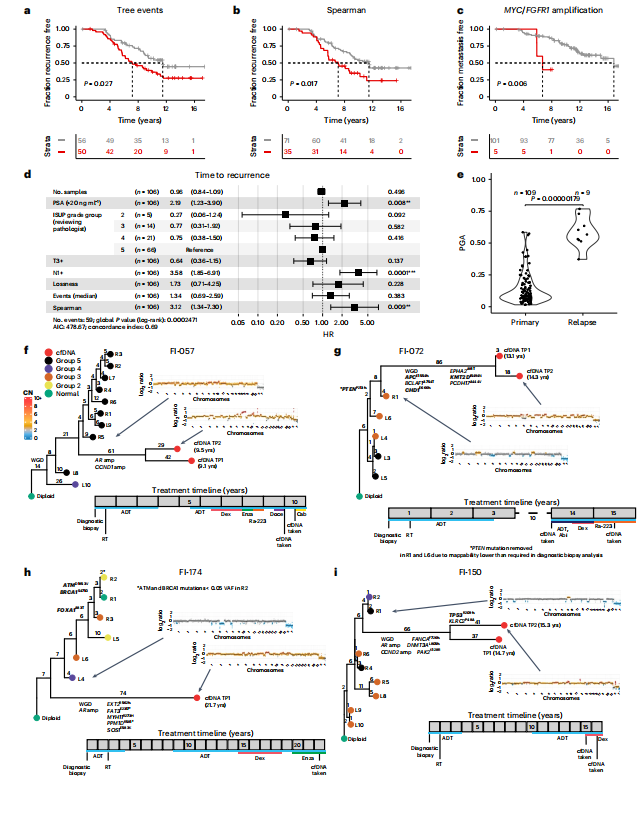
Fig. 3 | Spatial genetic diversity and phylogenetic events predict recurrence.a,b, Total phylogenetic tree events (two-sided log-rank test, χ2 = 4.9, d.f. = 1; a) and the Spearman metric (two-sided log-rank test, χ2 = 5.7, d.f. = 1; b) predict earlier time to recurrence (n = 106 participants, sequencing cohort IMRT participants with three or more samples with a PGA of ≥0.01). c, Amplification in MYC and/or FGFR1 (coamplified in one participant) predicts earlier time to metastasis (two-sided log-rank test, χ2 = 7.5, d.f. = 1, n = 106 participants). d, Cox proportional hazards (CPH) model of time to recurrence using clinical covariates and number of low-pass WGS samples with CNAs. Three metrics significant in a univariate CPH model (P < 0.1) are also included in the model (natural log of lossness, total phylogenetic events split by median value and Spearman). The forest plot shows 95% CI of HRs and the covariate P values, derived from a Wald test (n = 106 participants, P* < 0.05, *P* < 0.01, P* < 0.001). HRs for lossness and Spearman represent the increase in hazard between their 5th and 95th percentile values (within the sequencing cohort). e, mPGA per participant in primary samples (n = 109 participants) compared to the mPGA of individual relapse samples (n = 9 samples, two-sided Mann–Whitney U-test, W = 962).f–i, Phylogenetic analysis of primary and relapse samples (cfDNA) taken at recurrence. Tips of tumor nodes represent either the automated classifier ISUP grade group (primary diagnostic biopsies) or a cfDNA sample (red). Time since the diagnostic biopsy is labeled next to the cfDNA nodes in years (yrs). Representative copy number profiles are shown for a single cfDNA sample and the primary diagnostic biopsy that is most related to the cfDNA. Edges are labeled with phylogenetic events plus specific CNA events (for example, whole-genome duplication (WGD) or gene amplification (amp)) or detected point mutations. Genes present in the diagnostic biopsy panel are highlighted in bold and may be detected in both the primary and relapse samples. Genes not in bold are only detectable in the relapse samples and may also be present in the diagnostic biopsies. Below each tree, the timeline shows treatment history. Each event is rounded to the nearest 6 months. Each square represents a year. reatment descriptions are written in shorthand; Abi, abiraterone acetate; Cab, cabazitaxel; CN, copy number; Dex, dexamethasone; Doce, docetaxel; Enza, enzalutamide; Ra-223, radium-223; RT, radiotherapy; Salv. HiFU, salvage high-intensity focused ultrasound; VAF, variant allele frequency.
图3 | 空间遗传多样性和系统发育事件预测复发。
a,b, 总的系统发育树事件(双侧log-rank检验,χ2 = 4.9,自由度=1;a)和Spearman指标(双侧log-rank检验,χ2 = 5.7,自由度=1;b)预测较早的复发时间(n = 106名参与者,测序队列IMRT参与者,具有三个或更多样本且PGA ≥0.01)。c, MYC和/或FGFR1的扩增(在一个参与者中共扩增)预测较早的转移时间(双侧log-rank检验,χ2 = 7.5,自由度=1,n = 106名参与者)。d, 使用临床协变量和具有CNA的低通量WGS样本数量的复发时间Cox比例风险(CPH)模型。单变量CPH模型中显著的三个指标(P < 0.1)也包括在模型中(损失的自然对数,总系统发育事件按中位值分割和Spearman)。森林图显示HR的95%置信区间和协变量P值,由Wald检验得出(n = 106名参与者,P < 0.05,P < 0.01,P < 0.001)。损失和Spearman的HR表示在第5和第95百分位值之间危险的增加(在测序队列中)。e, 比较参与者在初级样本中的mPGA(n = 109名参与者)与个体复发样本的mPGA(n = 9个样本,双侧Mann–WhitneyU-检验,W = 962)。
f–i, 在复发时采集的初级和复发样本(cfDNA)的系统发育分析。肿瘤节点的尖端代表自动分类器的ISUP等级组(初级诊断活检)或cfDNA样本(红色)。自诊断活检以来的时间以年(年)为单位标注在cfDNA节点旁边。显示了单个cfDNA样本和与cfDNA最相关的初级诊断活检的代表性拷贝数谱。边缘标有系统发育事件加上特定的CNA事件(例如,全基因组复制(WGD)或基因扩增(amp))或检测到的点突变。在诊断活检面板中存在的基因以粗体突出显示,可能在初级和复发样本中检测到。未加粗的基因仅在复发样本中可检测到,也可能存在于诊断活检中。在每个树的下方,时间轴显示治疗历史。每个事件四舍五入到最近的6个月。每个方块代表一年。治疗描述以简写形式书写;Abi,醋酸阿比特龙;Cab,卡巴他赛;CN,拷贝数;Dex,地塞米松;Doce,多西他赛;Enza,恩杂鲁胺;Ra-223,镭-223;RT,放疗;Salv. HiFU,挽救性高强度聚焦超声;VAF,变异等位基因频率。
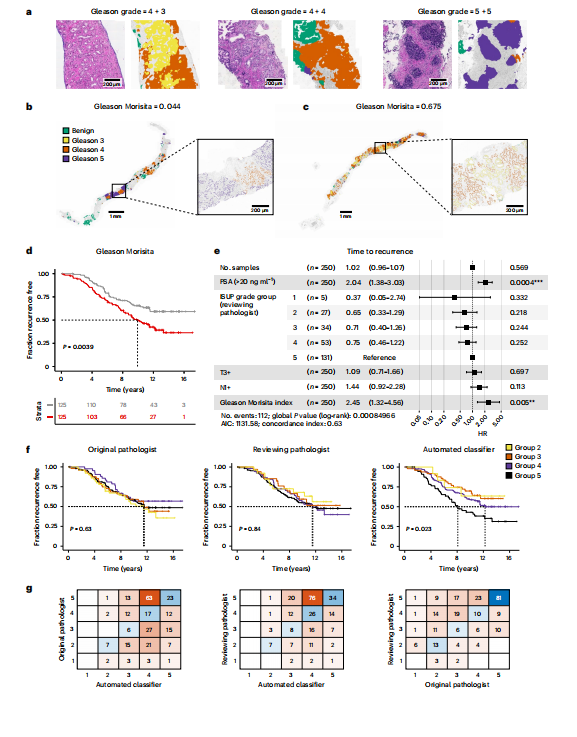
Fig. 4 | Morphological spatial heterogeneity with deep learning-based Gleason grading. a, Example output from the automated Gleason classifier, with primary and secondary pattern assessment. b,c, Examples of the Gleason Morisita assessment. Cells identified as epithelial cells by the cell classifier are subdivided into Gleason grades using the region’s automated Gleason segmentation. Regions with high segregation of patterns (b) will be assigned a low Gleason Morisita index, whereas regions with high mixing between Gleason grades (c) will be assigned a high Gleason Morisita index. d, Participants with greater within-section heterogeneity of Gleason pattern, as assessed by Gleason Morisita index, are associated with a shorter time to recurrence (two-sided log-rank test, χ2 = 8.33, d.f. = 1, P = 0.0039; imaging cohort, n = 250 participants). e, CPH model of time to recurrence using clinical covariates and the Gleason Morisita index (imaging cohort, n = 250 participants, P* < 0.05, *P* < 0.01, P < 0.001). The forest plot shows 95% CI of HRs and the covariate P values, derived from a Wald test. HR for the Gleason Morisita index represents the increase in hazard between the 5th and 95th percentile values (within the imaging cohort). f, ISUP grade group as a predictor of time to recurrence. A comparison is shown for the grade groups assessed by the original reporting pathologist, the reviewing pathologist for the trial and the automated classifier (imaging cohort, n = 250 participants). Grade groups are calculated from the assessed primary and secondary patterns, according to the 2014 ISUP criteria. Only the automated Gleason assessment was able to stratify the participants by time to recurrence (two-sided log-rank test, χ2 = 9.52, d.f. = 3, P = 0.023). g, Confusion matrices showing the pairwise agreement of the ISUP grade groups reported by the original reporting pathologist, the reviewing pathologist for the trial and the automated classifier (imaging cohort, n = 250 participants).
图4 | 基于深度学习的Gleason分级的形态空间异质性。a, 自动Gleason分类器的示例输出,包括主要和次要模式评估。b,c, Gleason Morisita评估的示例。细胞分类器识别为上皮细胞的细胞通过区域的自动Gleason分割细分为Gleason等级。模式高度分离的区域(b)将被分配较低的Gleason Morisita指数,而Gleason等级高度混合的区域(c)将被分配较高的Gleason Morisita指数。d, Gleason模式在切片内异质性较大的参与者(通过Gleason Morisita指数评估)与较短的复发时间相关(双侧log-rank检验,χ2 = 8.33,自由度=1,P = 0.0039;成像队列,n = 250名参与者)。e, 使用临床协变量和Gleason Morisita指数的复发时间CPH模型(成像队列,n = 250名参与者,P < 0.05,P < 0.01,P < 0.001)。森林图显示HR的95%置信区间和协变量P值,由Wald检验得出。Gleason Morisita指数的HR表示在第5和第95百分位值之间危险的增加(在成像队列中)。f, ISUP等级组作为复发时间的预测因子。比较了原报告病理学家、试验审查病理学家和自动分类器评估的等级组(成像队列,n = 250名参与者)。根据2014年ISUP标准,从评估的主要和次要模式计算等级组。只有自动Gleason评估能够按复发时间对参与者进行分层(双侧log-rank检验,χ2 = 9.52,自由度=3,P = 0.023)。g, 显示原报告病理学家、试验审查病理学家和自动分类器报告的ISUP等级组配对一致性的混淆矩阵(成像队列,n = 250名参与者)。
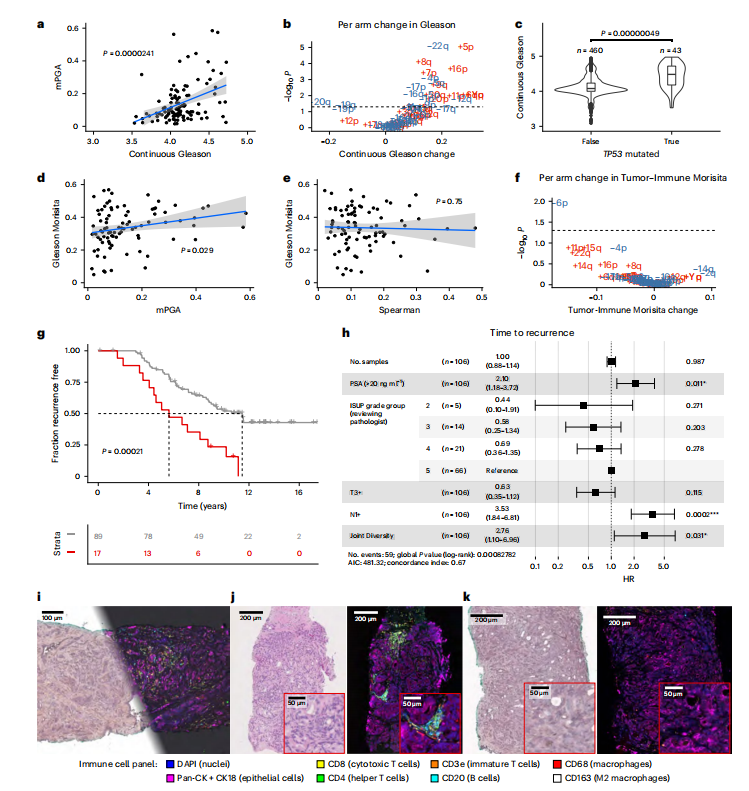
Fig. 5 | Combining genetic and morphological measurements. a, mPGA is associated with higher continuous Gleason (n = 106 participants, IMRT participants with three or more samples with a PGA of ≥0.01, linear model, twosided t-test on gradient, estimate = 0.19, s.e. = 0.04, t = 4.4, d.f. = 104). Shaded area represents 95% CI in all scatter plots. b, Twenty-four chromosome arm changes are associated with a change in continuous Gleason (gains are displayed in red, and losses are displayed in blue; n = 62 chromosome arm changes, P values were adjusted using the Benjamini–Hochberg method and are derived from twosided *t*-tests on gradient per arm linear mixed effects model; continuous Gleason change derived from gradient estimate). c, The TP53 mutation is associated with higher continuous Gleason (linear mixed effects model, two-sidedt-test on gradient, s.e. = 0.06, d.f. = 371,t = 5.1, n = 503 samples). Box plots show center lines as the median and box limits as upper and lower quartiles. Whiskers extend no further than 1.5× interquartile range past the box limits, and points represent outliers. d,e, mPGA (linear model, two-sided t-test on gradient, estimate = 0.23, s.e. = 0.103, t = 2.2, d.f. = 85; d), but not Spearman (estimate = −0.05, s.e. = 0.15, t = −0.3, d.f. = 85; e), is associated with increased mixing of Gleason grades (*n* = 87 participants, sequencing cohort omitting participants with a Gleason Morisita equal to 0, that is, a homogenous Gleason grade). f, Chromosome 6p loss is uniquely associated with a reduction in Tumor-Immune Morisita (changes are colored and P values were adjusted and derived as in b; n = 62 chromosome arm changes). Samples in b, c and f have a PGA of ≥0.01. g, The most genetically and morphologically heterogeneous tumors are associated with shorter time to recurrence (two-sided log-rank test, χ2 = 13.7, d.f. = 1, n = 106 participants). h, The Joint Diversity metric shows significant association with greater risk of recurrence in a CPH model with clinical covariates. The forest plot shows 95% CI of HRs, and the covariate P values are derived from a Wald test. The HR for Joint Diversity represents the increase in hazard between the 5th and 95th percentile values (within the sequencing cohort, *n* = 106 participants, P < 0.05, P < 0.01, P* < 0.001). i, Multiplex immunohistochemistry and H&E staining was performed on the same section. Immunohistochemistry experiments were run once following optimization and validation. j, Example of an immune-hot region on matched H&E (left) and multiplex immunohistochemistry (right) images. k, Example of an immune-cold region on matched H&E (left) and multiplex immunohistochemistry (right) images.
图5 | 结合遗传和形态测量。a, mPGA与较高的连续Gleason评分相关(n = 106名参与者,IMRT参与者,具有三个或更多样本且PGA ≥0.01,线性模型,梯度的双侧t检验,估计值 = 0.19,标准误差 = 0.04,t = 4.4,自由度 = 104)。阴影区域表示所有散点图中的95%置信区间。b, 24条染色体臂的变化与连续Gleason评分的变化相关(增益显示为红色,丧失显示为蓝色;n = 62条染色体臂的变化,P值使用Benjamini–Hochberg方法调整,并来自于每条臂的梯度线性混合效应模型的双侧t检验;连续Gleason评分的变化来自梯度估计)。c, TP53突变与较高的连续Gleason评分相关(线性混合效应模型,梯度的双侧t检验,标准误差 = 0.06,自由度 = 371,t = 5.1,n = 503个样本)。箱线图显示中心线为中位数,箱体边界为上四分位数和下四分位数。须线延伸不超过箱体边界1.5倍的四分位距,点表示离群值。d,e, mPGA(线性模型,梯度的双侧t检验,估计值 = 0.23,标准误差 = 0.103,t = 2.2,自由度 = 85;d),而非Spearman(估计值 = −0.05,标准误差 = 0.15,t = −0.3,自由度 = 85;e),与Gleason等级混合度增加相关(n = 87名参与者,测序队列中省略了Gleason Morisita等于0的参与者,即Gleason等级均匀)。f, 染色体6p丧失与肿瘤免疫Morisita减少独特相关(变化以颜色表示,P值按b中的方法调整和导出;n = 62条染色体臂的变化)。g, 遗传和形态异质性最大的肿瘤与较短的复发时间相关(双侧log-rank检验,χ2 = 13.7,自由度 = 1,n = 106名参与者)。h, 联合多样性指标在具有临床协变量的CPH模型中与较高的复发风险显著相关。森林图显示HR的95%置信区间,并由Wald检验导出的协变量*P*值。联合多样性的HR表示在第5和第95百分位值之间危险的增加(在测序队列中,n = 106名参与者,P < 0.05,P < 0.01,P < 0.001)。i, 对同一切片进行了多重免疫组织化学染色和H&E染色。免疫组织化学实验在优化和验证后进行了一次。j, 匹配H&E(左)和多重免疫组织化学(右)图像上免疫热区的示例。k, 匹配H&E(左)和多重免疫组织化学(右)图像上免疫冷区的示例。


![CSS学习笔记[Web开发]](https://i-blog.csdnimg.cn/direct/309077970fa44095bc33595da254a4cd.gif)