Title
题目
TS-AI: A deep learning pipeline for multimodal subject-specific parcellation with task contrasts synthesis
TS-AI:一种用于多模态个体化脑区划分的深度学习管道,并结合任务对比合成
01
文献速递介绍
人类大脑在结构和功能组织上表现出显著的个体差异(Frost 和 Goebel, 2012;Mueller 等, 2013)。大脑图谱,通过划分解剖上独立且功能上专门化的皮层亚区,成为神经科学研究和临床实践中的宝贵工具(Fan 等, 2016;Glasser 等, 2016)。然而,直接基于形态学信息将这些图谱配准到个体空间,往往忽视了受试者之间在区域位置和地形上的差异,导致个体图谱映射的不准确(Glasser 等, 2016)。因此,精确地映射个体层面的功能区对于全面理解大脑功能和行为的差异至关重要(Keller 等, 2024;Shanmugan 等, 2021;Zhou 等, 2023)。这不仅有助于准确诊断脑部疾病(Meng 等, 2021;Zhao 等, 2023),还可以实现个性化治疗,例如经颅磁刺激(Ren 等, 2023)和深部脑刺激的靶向定位(Patriat 等, 2018)。
磁共振成像(MRI)是一种非侵入性技术,用于测量大脑结构和功能,对于获得个体化的大脑映射至关重要。研究人员使用了静息态功能性磁共振成像(rsfMRI)(Gordon 等, 2017c;Honnorat 等, 2017;Kong 等, 2019;Li 等, 2023;Wang 等, 2015)、扩散磁共振成像(dMRI)(Han 等, 2020;Ma 等, 2024)、结构性磁共振成像(sMRI)(Bayrak 等, 2022)和任务态功能性磁共振成像(tfMRI)(Glasser 等, 2016)开发了个体化图谱。证据表明,与单一模态的MRI数据相比,整合多模态能够提供大脑功能和结构的综合剖面(基于纤维束解剖连接和静息态网络的功能信息)。在模型的第二阶段,合成的对比图和纤维束解剖连接及静息态网络的特征图一起被输入到端到端的深度神经网络中进行图谱个性化处理。本研究的优势在于利用从rsfMRI和dMRI预测的合成任务对比图进行个体分区,而无需实际获取任务态fMRI扫描。另一个贡献是提出了一种新颖的特征一致性损失,通过将具有相似特征的顶点分配到同一分区,从而提高个体特异性。这在缺乏个体图谱的真实标签时非常有效,能够充分利用深度网络在自适应特征提取和端到端学习中的能力,以实现图谱的个性化。
第二阶段的损失函数结合了监督图谱一致性损失和无监督特征一致性损失,前者确保个体化图谱与参考图谱之间的相似性。值得注意的是,TS-AI的学习过程中并未使用个体分区作为监督信息。通过包括测试-重测信度、一致性分析和行为预测在内的综合验证,使用了Human Connectome Project (HCP) 和独立的中国HCP (CHCP) 数据集。此外,我们进行了灵敏度分析,以评估输入特征对每个功能区个性化的贡献。进一步地,我们将TS-AI应用于阿尔茨海默病(AD)队列,发现TS-AI导出的区域变化反映了AD的进展,表明其在神经精神疾病进展监测中的潜力。
Aastract
摘要
Accurate mapping of brain functional subregions at an individual level is crucial. Task-based functional MRI(tfMRI) captures subject-specific activation patterns during various functions and behaviors, facilitating the individual localization of functionally distinct subregions. However, acquiring high-quality tfMRI is timeconsuming and resource-intensive in both scientific and clinical settings. The present study proposes a twostage network model, TS-AI, to individualize an atlas on cortical surfaces through the prediction of tfMRIdata. TS-AI first synthesizes a battery of task contrast maps for each individual by leveraging tract-wiseanatomical connectivity and resting-state networks. These synthesized maps, along with feature maps of tractwise anatomical connectivity and resting-state networks, are then fed into an end-to-end deep neural networkto individualize an atlas. TS-AI enables the synthesized task contrast maps to be used in individual parcellationwithout the acquisition of actual task fMRI scans. In addition, a novel feature consistency loss is designed toassign vertices with similar features to the same parcel, which increases individual specificity and mitigatesoverfitting risks caused by the absence of individual parcellation ground truth. The individualized parcellationswere validated by assessing test-retest reliability, homogeneity, and cognitive behavior prediction using diversereference atlases and datasets, demonstrating the superior performance and generalizability of TS-AI. Sensitivityanalysis yielded insights into region-specific features influencing individual variation in functional regionalization. Additionally, TS-AI identified accelerated shrinkage in the medial temporal and cingulate parcels duringthe progression of Alzheimer’s disease, suggesting its potential in clinical research and applications.
对个体层面进行大脑功能亚区的精确映射至关重要。任务态功能性磁共振成像(task-based functional MRI,tfMRI)可以捕捉个体在执行不同功能和行为时的特定激活模式,从而实现功能区的个体定位。然而,在科研和临床环境中获取高质量的tfMRI数据耗时且资源密集。为了解决这一问题,本研究提出了一个两阶段的网络模型——TS-AI,用于通过预测tfMRI数据在皮层表面上个性化构建大脑区划图。
TS-AI首先基于纤维束解剖连接和静息态网络,为每个个体合成一组任务对比图。这些合成的对比图以及纤维束解剖连接和静息态网络的特征图被输入到一个端到端的深度神经网络中,用于个性化大脑区划。TS-AI允许使用合成的任务对比图进行个体分区,而无需实际获取任务态fMRI扫描。此外,设计了一种新颖的特征一致性损失,用以将具有相似特征的顶点分配到同一区域,从而增强个体特异性并降低由于缺乏个体分区的真实标签而导致的过拟合风险。
通过测试-重测信度、一致性以及认知行为预测,基于不同的参考图谱和数据集对个性化分区进行了验证,展示了TS-AI的卓越性能和泛化能力。灵敏度分析为影响个体功能区域差异的特定区域特征提供了见解。此外,TS-AI识别出阿尔茨海默病进展过程中内侧颞叶和扣带回区域的加速萎缩,表明该方法在临床研究和应用中的潜力。
Method
方法
2.1. Datasets acquisition, MRI preprocessing, and features extraction
2.1.1. HCP dataset
The present study utilized the Human Connectome Project (HCP) fortraining, inference, and validation of the TS-AI model. The T1- and T2-weighted structural MRI, rsfMRI, tfMRI, and dMRI data were obtainedfrom the HCP S1200 release. These images were preprocessed using theHCP minimal preprocessing pipelines (https://github.com/WashingtonUniversity/HCPpipelines). From the acquired data, we selecteda subset of 968 participants (454 males, aged 22–37 years) who hadsuccessfully preprocessed multimodal images for further analysis. Thestudy also incorporated behavioral data (n = 953) and retest imagingdata (n = 39).
2.1. 数据集获取、MRI预处理和特征提取
2.1.1. HCP 数据集
本研究使用了人类连接组计划(Human Connectome Project,HCP)数据集对TS-AI模型进行训练、推理和验证。T1加权和T2加权结构性MRI、静息态功能性MRI(rsfMRI)、任务态功能性MRI(tfMRI)和扩散MRI(dMRI)数据均来自HCP S1200版本。这些图像使用HCP的最小预处理流程(https://github.com/Washington-University/HCPpipelines)进行了预处理。我们从获取的数据中选择了968名参与者(454名男性,年龄22-37岁),这些参与者的多模态图像成功预处理并用于进一步分析。研究还结合了行为数据(n = 953)和重测成像数据(n = 39)。
Conclusion
结论
3.1. Synthesizing task activation mapsIn our evaluation of the task contrast map synthesis using the synthesis sub-model, we included 39 participants from the HCP test-retestdataset who underwent sMRI, rsfMRI, and tfMRI scans. We comparedthe synthesized maps with both group-averaged maps and individualtarget (i.e., test) and repeat (i.e., retest) maps. The group-average taskcontrast maps were created by averaging the maps from all participantsin the HCP test dataset. As shown in Fig. 2a, the synthesized mapsexhibited the highest Pearson’s correlation coefficient (PCC) and DiceAUC with both the target and the repeat maps, outperforming the groupaverage maps. Detailed results for Dice curves and PCCs of each taskcontrast can be found in Supplementary Figure 2 and SupplementaryTable 1, respectively. Fig. 2b provides a visual representation of theRelational task Match contrast, featuring three randomly selected examples from the 39 participants. Echoing the overall findings, the synthesized maps in these examples demonstrated higher PCC and DiceAUC with both the test and retest maps compared to the group-averagemaps. Notably, the regions with high activation (marked by blue triangles) mirrored subject-specific patterns seen in the target and repeatmeasured maps, illustrating improved specificity over the groupaverage maps. Furthermore, the subject-specificity of the synthesizedmaps was evidenced by their higher similarity to each participant’scorresponding target maps rather than to the target maps of other participants (Supplementary Figure 3).
3.1. 合成任务激活图 在任务对比图合成子模型的评估中,我们选取了39名来自HCP测试-重测数据集的参与者,这些参与者进行了sMRI、rsfMRI和tfMRI扫描。我们将合成的图与群体平均图、个体目标(即测试图)和重测图进行对比。群体平均任务对比图是通过对HCP测试数据集中所有参与者的图进行平均得到的。如图2a所示,合成的图与目标图和重测图相比,展示出了最高的Pearson相关系数(PCC)和Dice曲线下面积(AUC),优于群体平均图。每个任务对比的Dice曲线和PCC的详细结果分别见补充图2和补充表1。图2b展示了关系任务匹配对比的可视化结果,其中包含从39名参与者中随机选择的三个示例。与整体结果相符,这些示例中的合成图与测试图和重测图相比,展示了更高的PCC和DiceAUC,优于群体平均图。特别是高激活区域(用蓝色三角形标记)与目标图和重测图中的个体特异性模式相一致,表明其在群体平均图基础上具有更高的特异性。此外,合成图的个体特异性通过其与每位参与者的对应目标图相比其他参与者的目标图的更高相似性得以验证(补充图3)。
Figure
图
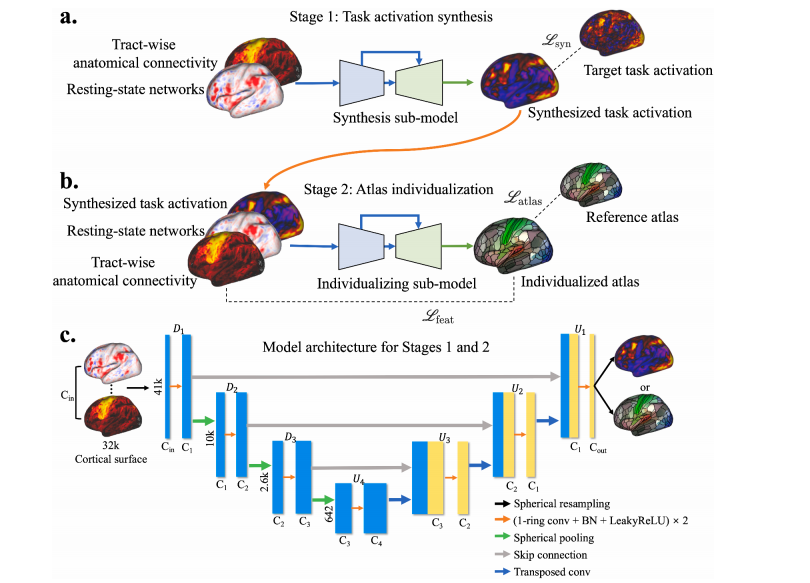
Fig. 1. Schematic of the TS-AI (atlas individualizing with task contrasts synthesis) workflow. TS-AI consists of two stages, each corresponding to a sub-model: taskcontrasts synthesis (a) and atlas individualizing (b). a. In the task contrasts synthesis stage, the tract-wise anatomical connectivity and resting-state networks areserved as inputs to synthesize a battery of task contrasts. b. In the atlas individualizing stage, the synthesized task contrasts, along with tract-wise anatomicalconnectivity and resting-state networks, contribute to the generation of individualized atlases. c. The architecture for both sub-models is a Spherical U-Net, featuringthree downsampling and four upsampling blocks. L syn, task contrast map synthesis loss; L atlas, atlas consistency loss; L feat, feature consistency loss; conv, sphericalconvolution; BN, BatchNorm layer.
图1. TS-AI(基于任务对比合成的图谱个性化)工作流程示意图。TS-AI包括两个阶段,每个阶段对应一个子模型:任务对比合成(a)和图谱个性化(b)。a. 在任务对比合成阶段,纤维束解剖连接和静息态网络作为输入,用于合成一系列任务对比图。b. 在图谱个性化阶段,合成的任务对比图以及纤维束解剖连接和静息态网络共同用于生成个性化图谱。c. 两个子模型的架构均为Spherical U-Net,具有三个下采样和四个上采样模块。L syn,任务对比图合成损失;L atlas,图谱一致性损失;L feat,特征一致性损失;conv,球面卷积;BN,BatchNorm层。
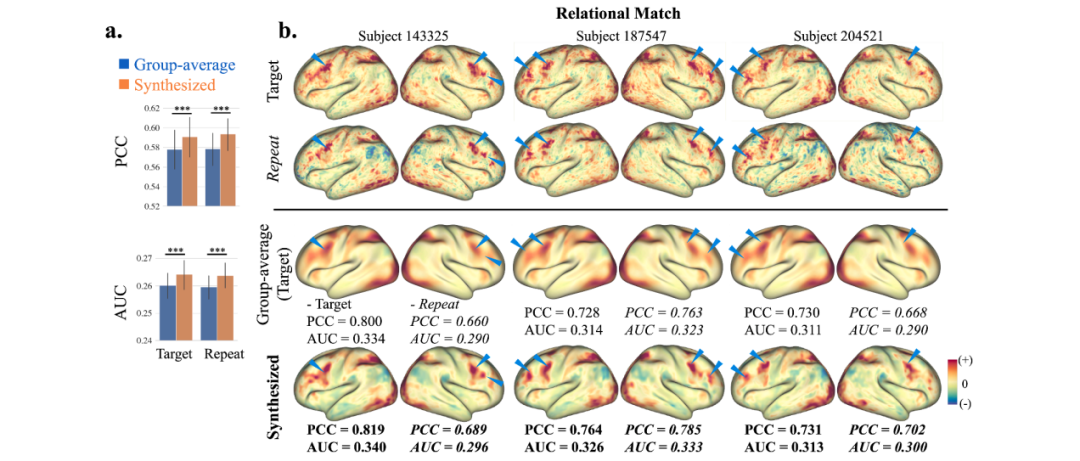
Fig. 2. The synthesized contrast maps outperformed group-average contrast maps in capturing individual-specific features across HCP task contrasts. Quantitativemetrics include Pearson correlation coefficient (PCC) and area under the curve (AUC) of Dice coefficient between target (i.e., test data) or repeat (i.e., retest data) andgroup-average or synthesized maps. a. The synthesized maps exhibit superior PCC and Dice AUC relative to group-average maps for both target and repeat mapsamong 39 test-retest participants across 24 task contrasts. The group-average maps were averaged from the target maps of the 39 participants. b. Target, repeat,group-average and synthesized maps of Relational task Match contrast for three representative participants in the HCP dataset. Regions with high activations insynthesized maps showed subject-specific patterns similar to their target and repeat maps, marked by blue triangles. This suggests TS-AI’s superior ability to capturefine-grained, individual-specific features compared to group-average maps. For each participant, PCC and Dice AUC values for target and group-average/synthesizedcontrast maps are shown in normal font, and the values for repeat and group-average/synthesized contrast maps are shown in italics. , two-tailed paired t-test p< 0.001.
图2. 合成的对比图在捕捉HCP任务对比中的个体特异性特征方面优于群体平均对比图。定量指标包括Pearson相关系数(PCC)和Dice系数的曲线下面积(AUC),用于比较目标图(即测试数据)或重测图(即重测数据)与群体平均图或合成图之间的差异。a. 在39名测试-重测参与者的24个任务对比中,合成图在PCC和Dice AUC方面相较于群体平均图表现出更优异的结果,适用于目标图和重测图。群体平均图是从这39名参与者的目标图中计算出的平均图。b. HCP数据集中三个具有代表性的参与者在关系任务匹配对比中的目标图、重测图、群体平均图和合成图。合成图中高激活区域展示了与其目标图和重测图相似的个体特异性模式(用蓝色三角形标记)。这表明TS-AI在捕捉细粒度、个体特异性特征方面优于群体平均图。对于每位参与者,目标图与群体平均图/合成图的PCC和Dice AUC值以常规字体显示,而重测图与群体平均图/合成图的值以斜体显示。双尾配对t检验,p < 0.001。
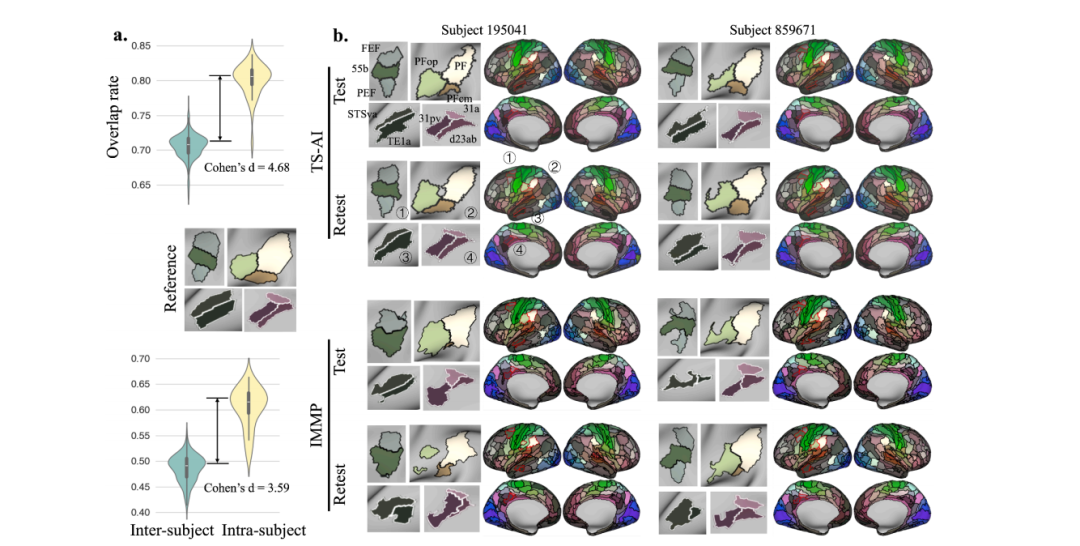
Fig. 3. Reproducibility and specificity of TS-AI and IMMP using HCP test-retest dataset (n = 39). a. Violin plots show the overlap rates of inter- and intra-subjectpairs, with higher effect size (Cohen’s d) of TS-AI than IMMP. b. Visual illustrations of TS-AI-based and IMMP-based individualized Glasser atlas of two randomlyselected participants, with four magnified regional parcellations (red boundaries in whole-brain views) showing high inter-subject variability and intra-subjectconsistency. The middle panel between the two violin plots is the group-level Glasser atlas of the four exemplar regions. Visual comparisons for three additionalparticipants are shown in Supplementary Figure 4. 31pv, area 31p ventral; 31a, area 31a; d23ab, area dorsal 23 a + b; FEF, frontal eye field; PEF, premotor eye field;PF, area PF complex; PFop, area PF opercular; PFcm, area PFcm; STSva, area STSv anterior; TE1a, area TE1 anterior.
图3. 使用HCP测试-重测数据集(n = 39)对TS-AI和IMMP的可重复性和特异性进行评估。a. 小提琴图显示了受试者间和受试者内的重叠率,TS-AI的效果量(Cohen's d)高于IMMP。b. TS-AI和IMMP基础上个性化的Glasser图谱的视觉展示,展示了两名随机选择的参与者的全脑视图,并放大了四个区域(全脑视图中的红色边界),这些区域显示了受试者间的高度变异性和受试者内的一致性。两组小提琴图之间的中间面板为这四个示例区域的群体级Glasser图谱。三名其他参与者的视觉比较见补充图4。区域缩写包括:31pv,腹侧31p区;31a,31a区;d23ab,背侧23a + b区;FEF,额眼场;PEF,前运动眼场;PF,PF复杂区;PFop,PF操作区;PFcm,PFcm区;STSva,STS前部区域;TE1a,TE1前部区域。
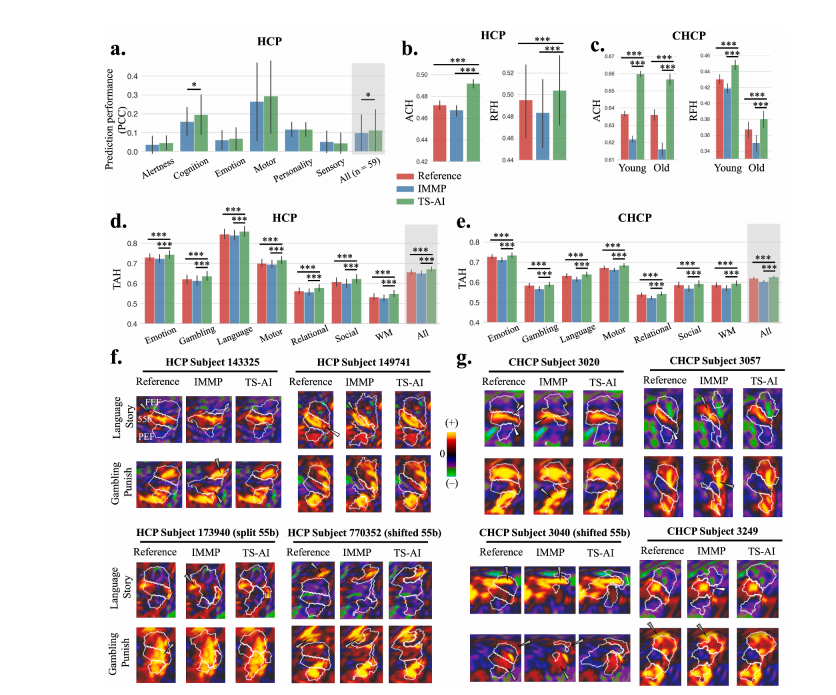
Fig. 4. Validations of TS-AI using HCP and independent CHCP datasets. a. Kernel Ridge Regression models were employed to predict 59 behavioral measures acrosssix domains using individualized parcellations based on the Glasser atlas (n = 953). Two-tailed paired t-tests were used to compare the performance of TS-AI andIMMP for each of the six subdomains and across all 59 behaviors. TS-AI showed significantly better performance than IMMP in the prediction of the Cognitionsubdomain and the aggregate of all measures. b and c. TS-AI demonstrated significantly higher anatomical connectivity homogeneity and resting-state functionalhomogeneity compared to the registration-based reference atlas and IMMP on HCP retest (b, n = 39) and CHCP young (c, n = 221, aged 18–33 years) and old (c, n =94, aged 48–79 years) participants. d and e. TS-AI demonstrated significantly higher task activation homogeneity across all seven tasks on HCP retest (d, n = 39) andCHCP young (e, n = 160) participants. Note that only a part of CHCP young participants acquired tfMRI data. f and g. Task contrast maps of HCP retest (f) and CHCP(g) data for the Language task Story contrast and Gambling task Punish contrast in the left hemisphere were overlaid with the white contours of areas 55b, FEF, andPEF from three participants with atypical 55b (HCP subjects 173940 and 770352, and CHCP subject 3040) and five participants with typical 55b. The white arrowspoint to areas that were incorrectly included in a specific parcel, while the gray arrows point to areas that should have been included in the parcel but were omitted.TS-AI-derived parcel boundaries demonstrated better correspondence with the task contrast maps compared to IMMP-based and registration-based parcel boundaries. ACH, anatomical connectivity homogeneity; FEF, frontal eye field; IMMP, individualized multimodal parcellation (Glasser et al. 2016); PCC, Pearson’s correlation coefficient; PEF, premotor eye field; Reference, the reference atlas aligned to the individual space; RFH, resting-state functional homogeneity; TAH, taskactivation homogeneity; WM, working memory. Two-tailed paired t-tests were performed between TS-AI and IMMP/Reference with Bonferroni correction for (b) (c)and FDR correction for (a) (d) (e). , p < 0.05; , p < 0.001.
图4. 使用HCP和独立CHCP数据集对TS-AI的验证。a. 使用核岭回归模型基于个性化Glasser图谱预测59个行为测量,涉及六个领域(n = 953)。通过双尾配对t检验比较了TS-AI和IMMP在每个领域和所有59个行为上的表现。结果显示,TS-AI在认知领域及所有测量的综合表现上显著优于IMMP。b 和 c. 在HCP重测数据(b, n = 39)和CHCP年轻(c, n = 221,年龄18–33岁)及老年参与者(c, n = 94,年龄48–79岁)中,TS-AI在解剖连接一致性和静息态功能一致性上显著高于基于配准的参考图谱和IMMP。d 和 e. 在HCP重测(d, n = 39)和CHCP年轻参与者(e, n = 160)的七项任务中,TS-AI在任务激活一致性上表现出显著优势。请注意,只有部分CHCP年轻参与者获得了tfMRI数据。f 和 g. HCP重测(f)和CHCP(g)数据中左半球语言任务故事对比和赌博任务惩罚对比的任务对比图与三名具有非典型55b区(HCP受试者173940和770352,以及CHCP受试者3040)和五名具有典型55b区的参与者的55b区、FEF区和PEF区的白色轮廓叠加。白色箭头指向在特定区域中被错误包含的区域,灰色箭头指向应包含在该区域但被遗漏的区域。与基于IMMP和配准的区域边界相比,TS-AI导出的区域边界与任务对比图展示了更好的对应性。ACH,解剖连接一致性;FEF,额眼场;IMMP,个性化多模态分区(Glasser 等, 2016);PCC,Pearson相关系数;PEF,前运动眼场;参考,参考图谱与个体空间对齐;RFH,静息态功能一致性;TAH,任务激活一致性;WM,工作记忆。TS-AI与IMMP/参考之间的双尾配对t检验使用了Bonferroni校正(b, c)和FDR校正(a, d, e)。,*p < 0.05;**,p* < 0.001。
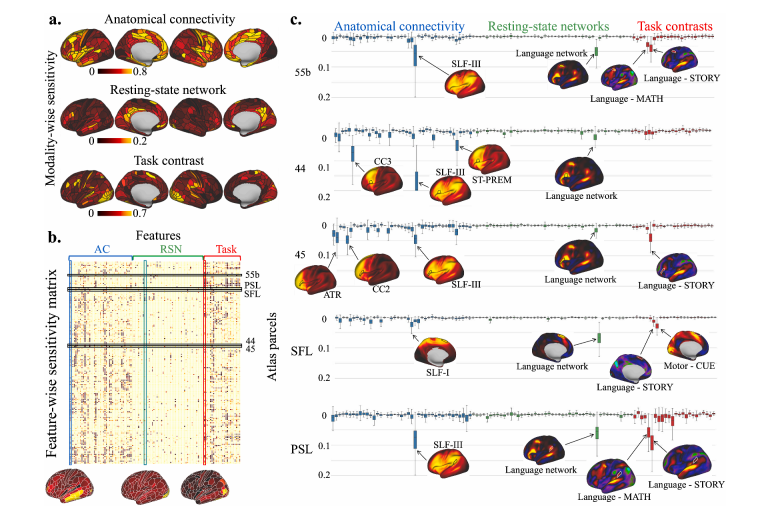
Fig. 5. Sensitivity analyses of features contributing to the atlas individualizing sub-model. a. Modality-wise sensitivity map showing the contributing patterns ofeach modality to the atlas individualizing sub-model. Anatomical connectivity features exhibited high sensitivity in the lateral and medial frontal lobe, resting-statenetwork features showed high sensitivity in posteromedial cortices, and task activation features contributed mostly to the occipital and temporal lobes. Bright yellowrepresents regions with highly discriminating features. b. The averaged feature-wise sensitivity matrix for the left hemisphere across subjects in the HCP first-fold testset. The sensitivity maps below illustrate three exemplar columns, each corresponding to the sensitivity patterns of distinct features. c. The boxplots depict fiveexemplar rows from (b), namely area 55b, area 44, area 45, superior frontal language area (SFL), and perisylvian language area (PSL), showcasing varying sensitivities for different parcels in the language network. On the bottom of the boxes, the corresponding average feature maps are overlaid with the boundaries of theirrespective parcels. AC, anatomical connectivity; RSN, resting-state network.
图5. 对图谱个性化子模型中特征贡献的敏感性分析。a. 各模态的敏感性图,展示了每种模态对图谱个性化子模型的贡献模式。解剖连接特征在外侧和内侧额叶表现出较高的敏感性,静息态网络特征在后中央皮层显示出较高的敏感性,而任务激活特征主要对枕叶和颞叶贡献较大。亮黄色表示具有高度区分特征的区域。b. 在HCP第一折测试集中,所有受试者左半球的平均特征敏感性矩阵。下方的敏感性图展示了三个示例列,每列对应不同特征的敏感性模式。c. 箱线图展示了(b)中的五个示例行,即55b区、44区、45区、上额语言区(SFL)和外侧裂周围语言区(PSL),展示了语言网络中不同分区的敏感性差异。在箱线图下方,分别叠加了这些分区边界的平均特征图。AC,解剖连接;RSN,静息态网络。
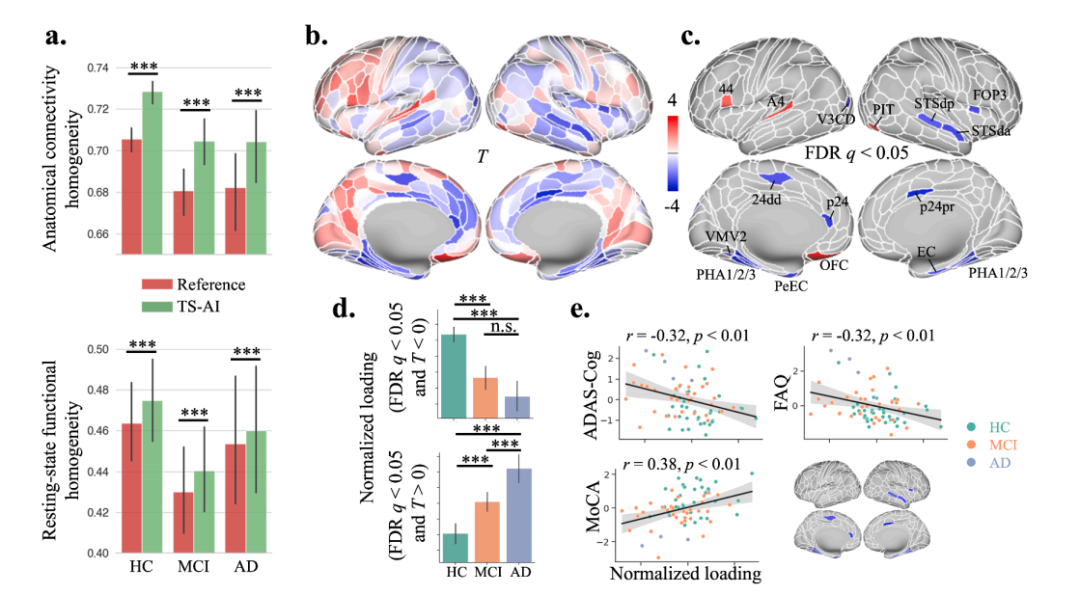
Fig. 6. TS-AI applications in Alzheimer’s disease analyses. a. Compared to the registration-based reference atlas, TS-AI demonstrated significantly higher anatomicalconnectivity homogeneity and resting-state functional homogeneity for HC, MCI, and AD participants in ADNI dataset. b. The correlation between HC/MCI/ADgroups and normalized parcel loadings assessed using generalized linear models, regressing out covariates including age, sex, head motion, and total intracranialvolume. Blue and red parcels represent faster and slower shrinkage relative to the whole cortical surface from HC towards MCI and AD, respectively. The color barindicates T values. c. The map shows the regions with significant changes from HC, MCI to AD (FDR q < 0.05). d. The total normalized loadings of significantly fastershrinkage parcels (FDR q < 0.05 and T < 0, blue) and slower shrinkage parcels (FDR q < 0.05 and T > 0, red) for HC, MCI, and AD. e. The normalized loadings infaster shrinkage parcels exhibit a significant negative correlation with ADAS-Cog and FAQ, and a significant positive correlation with MoCA. No significant correlation was observed between normalized loadings in slower shrinkage parcels and ADAS-Cog, FAQ, and MoCA. The y-axes of the scatter plots represent measuresthat were normalized and regressed out covariates including age, sex, head motion, and total intracranial volume. 24dd, dorsal area 24d; 44, area 44; A4, auditory 4complex; EC, entorhinal cortex; FOP3, frontal opercular area 3; OFC, orbital frontal complex; p24, area posterior 24; p24pr, area posterior 24 prime; PeEc, perirhinalentorhinal cortex; PHA 1/2/3, parahippocampal area 1/2/3; PIT, posterior inferotemporal; STSda, area STSd anterior; STSdp, area STSd posterior; V3CD, area V3CD;VMV2, ventromedial visual area 2. , two-sample t-test Bonferroni corrected p < 0.001, n.s., not significant.
图6. TS-AI 在阿尔茨海默病(AD)分析中的应用。a. 与基于配准的参考图谱相比,TS-AI 在ADNI数据集中HC(健康对照)、MCI(轻度认知障碍)和AD(阿尔茨海默病)参与者中表现出显著更高的解剖连接一致性和静息态功能一致性。b. 使用广义线性模型评估HC/MCI/AD组与归一化分区负载的相关性,控制年龄、性别、头部运动和颅内总容量等协变量。蓝色和红色分区分别表示从HC到MCI和AD过程中相对于整个皮层表面更快或更慢的萎缩。颜色条表示T值。c. 该图展示了从HC到MCI再到AD过程中有显著变化的区域(FDR q < 0.05)。d. 对HC、MCI和AD组中显著更快萎缩分区(FDR q < 0.05 且 T < 0,蓝色)和更慢萎缩分区(FDR q < 0.05 且 T > 0,红色)的归一化总负载进行比较。e. 更快萎缩分区的归一化负载与ADAS-Cog和FAQ呈显著负相关,与MoCA呈显著正相关。更慢萎缩分区的归一化负载与ADAS-Cog、FAQ和MoCA之间未观察到显著相关性。散点图的y轴表示归一化的测量值,并控制了年龄、性别、头部运动和颅内总容量等协变量。24dd,背侧24d区;44,44区;A4,听觉4区;EC,内嗅皮层;FOP3,额叶操作区3;OFC,眶额复杂区;p24,后部24区;p24pr,后部24 prime区;PeEc,旁嗅皮层;PHA 1/2/3,海马旁区1/2/3;PIT,后部颞下区;STSda,前STS d区;STSdp,后STS d区;V3CD,V3CD区;VMV2,腹内侧视觉区2。双样本t检验,Bonferroni校正 p < 0.001,n.s.,无显著差异。
Table
表
TS-AI:一种用于多模态个体化脑区划分的深度学习管道,并结合任务对比合成|文献速递
麦田医学 美好事物中转站 2024年09月23日 18:30 江苏
Title
题目
TS-AI: A deep learning pipeline for multimodal subject-specific parcellation with task contrasts synthesis
TS-AI:一种用于多模态个体化脑区划分的深度学习管道,并结合任务对比合成
01
文献速递介绍
人类大脑在结构和功能组织上表现出显著的个体差异(Frost 和 Goebel, 2012;Mueller 等, 2013)。大脑图谱,通过划分解剖上独立且功能上专门化的皮层亚区,成为神经科学研究和临床实践中的宝贵工具(Fan 等, 2016;Glasser 等, 2016)。然而,直接基于形态学信息将这些图谱配准到个体空间,往往忽视了受试者之间在区域位置和地形上的差异,导致个体图谱映射的不准确(Glasser 等, 2016)。因此,精确地映射个体层面的功能区对于全面理解大脑功能和行为的差异至关重要(Keller 等, 2024;Shanmugan 等, 2021;Zhou 等, 2023)。这不仅有助于准确诊断脑部疾病(Meng 等, 2021;Zhao 等, 2023),还可以实现个性化治疗,例如经颅磁刺激(Ren 等, 2023)和深部脑刺激的靶向定位(Patriat 等, 2018)。
磁共振成像(MRI)是一种非侵入性技术,用于测量大脑结构和功能,对于获得个体化的大脑映射至关重要。研究人员使用了静息态功能性磁共振成像(rsfMRI)(Gordon 等, 2017c;Honnorat 等, 2017;Kong 等, 2019;Li 等, 2023;Wang 等, 2015)、扩散磁共振成像(dMRI)(Han 等, 2020;Ma 等, 2024)、结构性磁共振成像(sMRI)(Bayrak 等, 2022)和任务态功能性磁共振成像(tfMRI)(Glasser 等, 2016)开发了个体化图谱。证据表明,与单一模态的MRI数据相比,整合多模态能够提供大脑功能和结构的综合剖面(基于纤维束解剖连接和静息态网络的功能信息)。在模型的第二阶段,合成的对比图和纤维束解剖连接及静息态网络的特征图一起被输入到端到端的深度神经网络中进行图谱个性化处理。本研究的优势在于利用从rsfMRI和dMRI预测的合成任务对比图进行个体分区,而无需实际获取任务态fMRI扫描。另一个贡献是提出了一种新颖的特征一致性损失,通过将具有相似特征的顶点分配到同一分区,从而提高个体特异性。这在缺乏个体图谱的真实标签时非常有效,能够充分利用深度网络在自适应特征提取和端到端学习中的能力,以实现图谱的个性化。
第二阶段的损失函数结合了监督图谱一致性损失和无监督特征一致性损失,前者确保个体化图谱与参考图谱之间的相似性。值得注意的是,TS-AI的学习过程中并未使用个体分区作为监督信息。通过包括测试-重测信度、一致性分析和行为预测在内的综合验证,使用了Human Connectome Project (HCP) 和独立的中国HCP (CHCP) 数据集。此外,我们进行了灵敏度分析,以评估输入特征对每个功能区个性化的贡献。进一步地,我们将TS-AI应用于阿尔茨海默病(AD)队列,发现TS-AI导出的区域变化反映了AD的进展,表明其在神经精神疾病进展监测中的潜力。
Aastract
摘要
Accurate mapping of brain functional subregions at an individual level is crucial. Task-based functional MRI(tfMRI) captures subject-specific activation patterns during various functions and behaviors, facilitating the individual localization of functionally distinct subregions. However, acquiring high-quality tfMRI is timeconsuming and resource-intensive in both scientific and clinical settings. The present study proposes a twostage network model, TS-AI, to individualize an atlas on cortical surfaces through the prediction of tfMRIdata. TS-AI first synthesizes a battery of task contrast maps for each individual by leveraging tract-wiseanatomical connectivity and resting-state networks. These synthesized maps, along with feature maps of tractwise anatomical connectivity and resting-state networks, are then fed into an end-to-end deep neural networkto individualize an atlas. TS-AI enables the synthesized task contrast maps to be used in individual parcellationwithout the acquisition of actual task fMRI scans. In addition, a novel feature consistency loss is designed toassign vertices with similar features to the same parcel, which increases individual specificity and mitigatesoverfitting risks caused by the absence of individual parcellation ground truth. The individualized parcellationswere validated by assessing test-retest reliability, homogeneity, and cognitive behavior prediction using diversereference atlases and datasets, demonstrating the superior performance and generalizability of TS-AI. Sensitivityanalysis yielded insights into region-specific features influencing individual variation in functional regionalization. Additionally, TS-AI identified accelerated shrinkage in the medial temporal and cingulate parcels duringthe progression of Alzheimer’s disease, suggesting its potential in clinical research and applications.
对个体层面进行大脑功能亚区的精确映射至关重要。任务态功能性磁共振成像(task-based functional MRI,tfMRI)可以捕捉个体在执行不同功能和行为时的特定激活模式,从而实现功能区的个体定位。然而,在科研和临床环境中获取高质量的tfMRI数据耗时且资源密集。为了解决这一问题,本研究提出了一个两阶段的网络模型——TS-AI,用于通过预测tfMRI数据在皮层表面上个性化构建大脑区划图。
TS-AI首先基于纤维束解剖连接和静息态网络,为每个个体合成一组任务对比图。这些合成的对比图以及纤维束解剖连接和静息态网络的特征图被输入到一个端到端的深度神经网络中,用于个性化大脑区划。TS-AI允许使用合成的任务对比图进行个体分区,而无需实际获取任务态fMRI扫描。此外,设计了一种新颖的特征一致性损失,用以将具有相似特征的顶点分配到同一区域,从而增强个体特异性并降低由于缺乏个体分区的真实标签而导致的过拟合风险。
通过测试-重测信度、一致性以及认知行为预测,基于不同的参考图谱和数据集对个性化分区进行了验证,展示了TS-AI的卓越性能和泛化能力。灵敏度分析为影响个体功能区域差异的特定区域特征提供了见解。此外,TS-AI识别出阿尔茨海默病进展过程中内侧颞叶和扣带回区域的加速萎缩,表明该方法在临床研究和应用中的潜力。
Method
方法
2.1. Datasets acquisition, MRI preprocessing, and features extraction
2.1.1. HCP dataset
The present study utilized the Human Connectome Project (HCP) fortraining, inference, and validation of the TS-AI model. The T1- and T2-weighted structural MRI, rsfMRI, tfMRI, and dMRI data were obtainedfrom the HCP S1200 release. These images were preprocessed using theHCP minimal preprocessing pipelines (https://github.com/WashingtonUniversity/HCPpipelines). From the acquired data, we selecteda subset of 968 participants (454 males, aged 22–37 years) who hadsuccessfully preprocessed multimodal images for further analysis. Thestudy also incorporated behavioral data (n = 953) and retest imagingdata (n = 39).
2.1. 数据集获取、MRI预处理和特征提取
2.1.1. HCP 数据集
本研究使用了人类连接组计划(Human Connectome Project,HCP)数据集对TS-AI模型进行训练、推理和验证。T1加权和T2加权结构性MRI、静息态功能性MRI(rsfMRI)、任务态功能性MRI(tfMRI)和扩散MRI(dMRI)数据均来自HCP S1200版本。这些图像使用HCP的最小预处理流程(https://github.com/Washington-University/HCPpipelines)进行了预处理。我们从获取的数据中选择了968名参与者(454名男性,年龄22-37岁),这些参与者的多模态图像成功预处理并用于进一步分析。研究还结合了行为数据(n = 953)和重测成像数据(n = 39)。
Conclusion
结论
3.1. Synthesizing task activation mapsIn our evaluation of the task contrast map synthesis using the synthesis sub-model, we included 39 participants from the HCP test-retestdataset who underwent sMRI, rsfMRI, and tfMRI scans. We comparedthe synthesized maps with both group-averaged maps and individualtarget (i.e., test) and repeat (i.e., retest) maps. The group-average taskcontrast maps were created by averaging the maps from all participantsin the HCP test dataset. As shown in Fig. 2a, the synthesized mapsexhibited the highest Pearson’s correlation coefficient (PCC) and DiceAUC with both the target and the repeat maps, outperforming the groupaverage maps. Detailed results for Dice curves and PCCs of each taskcontrast can be found in Supplementary Figure 2 and SupplementaryTable 1, respectively. Fig. 2b provides a visual representation of theRelational task Match contrast, featuring three randomly selected examples from the 39 participants. Echoing the overall findings, the synthesized maps in these examples demonstrated higher PCC and DiceAUC with both the test and retest maps compared to the group-averagemaps. Notably, the regions with high activation (marked by blue triangles) mirrored subject-specific patterns seen in the target and repeatmeasured maps, illustrating improved specificity over the groupaverage maps. Furthermore, the subject-specificity of the synthesizedmaps was evidenced by their higher similarity to each participant’scorresponding target maps rather than to the target maps of other participants (Supplementary Figure 3).
3.1. 合成任务激活图 在任务对比图合成子模型的评估中,我们选取了39名来自HCP测试-重测数据集的参与者,这些参与者进行了sMRI、rsfMRI和tfMRI扫描。我们将合成的图与群体平均图、个体目标(即测试图)和重测图进行对比。群体平均任务对比图是通过对HCP测试数据集中所有参与者的图进行平均得到的。如图2a所示,合成的图与目标图和重测图相比,展示出了最高的Pearson相关系数(PCC)和Dice曲线下面积(AUC),优于群体平均图。每个任务对比的Dice曲线和PCC的详细结果分别见补充图2和补充表1。图2b展示了关系任务匹配对比的可视化结果,其中包含从39名参与者中随机选择的三个示例。与整体结果相符,这些示例中的合成图与测试图和重测图相比,展示了更高的PCC和DiceAUC,优于群体平均图。特别是高激活区域(用蓝色三角形标记)与目标图和重测图中的个体特异性模式相一致,表明其在群体平均图基础上具有更高的特异性。此外,合成图的个体特异性通过其与每位参与者的对应目标图相比其他参与者的目标图的更高相似性得以验证(补充图3)。
Figure
图
Fig. 1. Schematic of the TS-AI (atlas individualizing with task contrasts synthesis) workflow. TS-AI consists of two stages, each corresponding to a sub-model: taskcontrasts synthesis (a) and atlas individualizing (b). a. In the task contrasts synthesis stage, the tract-wise anatomical connectivity and resting-state networks areserved as inputs to synthesize a battery of task contrasts. b. In the atlas individualizing stage, the synthesized task contrasts, along with tract-wise anatomicalconnectivity and resting-state networks, contribute to the generation of individualized atlases. c. The architecture for both sub-models is a Spherical U-Net, featuringthree downsampling and four upsampling blocks. L syn, task contrast map synthesis loss; L atlas, atlas consistency loss; L feat, feature consistency loss; conv, sphericalconvolution; BN, BatchNorm layer.
图1. TS-AI(基于任务对比合成的图谱个性化)工作流程示意图。TS-AI包括两个阶段,每个阶段对应一个子模型:任务对比合成(a)和图谱个性化(b)。a. 在任务对比合成阶段,纤维束解剖连接和静息态网络作为输入,用于合成一系列任务对比图。b. 在图谱个性化阶段,合成的任务对比图以及纤维束解剖连接和静息态网络共同用于生成个性化图谱。c. 两个子模型的架构均为Spherical U-Net,具有三个下采样和四个上采样模块。L syn,任务对比图合成损失;L atlas,图谱一致性损失;L feat,特征一致性损失;conv,球面卷积;BN,BatchNorm层。
Fig. 2. The synthesized contrast maps outperformed group-average contrast maps in capturing individual-specific features across HCP task contrasts. Quantitativemetrics include Pearson correlation coefficient (PCC) and area under the curve (AUC) of Dice coefficient between target (i.e., test data) or repeat (i.e., retest data) andgroup-average or synthesized maps. a. The synthesized maps exhibit superior PCC and Dice AUC relative to group-average maps for both target and repeat mapsamong 39 test-retest participants across 24 task contrasts. The group-average maps were averaged from the target maps of the 39 participants. b. Target, repeat,group-average and synthesized maps of Relational task Match contrast for three representative participants in the HCP dataset. Regions with high activations insynthesized maps showed subject-specific patterns similar to their target and repeat maps, marked by blue triangles. This suggests TS-AI’s superior ability to capturefine-grained, individual-specific features compared to group-average maps. For each participant, PCC and Dice AUC values for target and group-average/synthesizedcontrast maps are shown in normal font, and the values for repeat and group-average/synthesized contrast maps are shown in italics. , two-tailed paired t-test p< 0.001.
图2. 合成的对比图在捕捉HCP任务对比中的个体特异性特征方面优于群体平均对比图。定量指标包括Pearson相关系数(PCC)和Dice系数的曲线下面积(AUC),用于比较目标图(即测试数据)或重测图(即重测数据)与群体平均图或合成图之间的差异。a. 在39名测试-重测参与者的24个任务对比中,合成图在PCC和Dice AUC方面相较于群体平均图表现出更优异的结果,适用于目标图和重测图。群体平均图是从这39名参与者的目标图中计算出的平均图。b. HCP数据集中三个具有代表性的参与者在关系任务匹配对比中的目标图、重测图、群体平均图和合成图。合成图中高激活区域展示了与其目标图和重测图相似的个体特异性模式(用蓝色三角形标记)。这表明TS-AI在捕捉细粒度、个体特异性特征方面优于群体平均图。对于每位参与者,目标图与群体平均图/合成图的PCC和Dice AUC值以常规字体显示,而重测图与群体平均图/合成图的值以斜体显示。双尾配对t检验,p < 0.001。
Fig. 3. Reproducibility and specificity of TS-AI and IMMP using HCP test-retest dataset (n = 39). a. Violin plots show the overlap rates of inter- and intra-subjectpairs, with higher effect size (Cohen’s d) of TS-AI than IMMP. b. Visual illustrations of TS-AI-based and IMMP-based individualized Glasser atlas of two randomlyselected participants, with four magnified regional parcellations (red boundaries in whole-brain views) showing high inter-subject variability and intra-subjectconsistency. The middle panel between the two violin plots is the group-level Glasser atlas of the four exemplar regions. Visual comparisons for three additionalparticipants are shown in Supplementary Figure 4. 31pv, area 31p ventral; 31a, area 31a; d23ab, area dorsal 23 a + b; FEF, frontal eye field; PEF, premotor eye field;PF, area PF complex; PFop, area PF opercular; PFcm, area PFcm; STSva, area STSv anterior; TE1a, area TE1 anterior.
图3. 使用HCP测试-重测数据集(n = 39)对TS-AI和IMMP的可重复性和特异性进行评估。a. 小提琴图显示了受试者间和受试者内的重叠率,TS-AI的效果量(Cohen's d)高于IMMP。b. TS-AI和IMMP基础上个性化的Glasser图谱的视觉展示,展示了两名随机选择的参与者的全脑视图,并放大了四个区域(全脑视图中的红色边界),这些区域显示了受试者间的高度变异性和受试者内的一致性。两组小提琴图之间的中间面板为这四个示例区域的群体级Glasser图谱。三名其他参与者的视觉比较见补充图4。区域缩写包括:31pv,腹侧31p区;31a,31a区;d23ab,背侧23a + b区;FEF,额眼场;PEF,前运动眼场;PF,PF复杂区;PFop,PF操作区;PFcm,PFcm区;STSva,STS前部区域;TE1a,TE1前部区域。
Fig. 4. Validations of TS-AI using HCP and independent CHCP datasets. a. Kernel Ridge Regression models were employed to predict 59 behavioral measures acrosssix domains using individualized parcellations based on the Glasser atlas (n = 953). Two-tailed paired t-tests were used to compare the performance of TS-AI andIMMP for each of the six subdomains and across all 59 behaviors. TS-AI showed significantly better performance than IMMP in the prediction of the Cognitionsubdomain and the aggregate of all measures. b and c. TS-AI demonstrated significantly higher anatomical connectivity homogeneity and resting-state functionalhomogeneity compared to the registration-based reference atlas and IMMP on HCP retest (b, n = 39) and CHCP young (c, n = 221, aged 18–33 years) and old (c, n =94, aged 48–79 years) participants. d and e. TS-AI demonstrated significantly higher task activation homogeneity across all seven tasks on HCP retest (d, n = 39) andCHCP young (e, n = 160) participants. Note that only a part of CHCP young participants acquired tfMRI data. f and g. Task contrast maps of HCP retest (f) and CHCP(g) data for the Language task Story contrast and Gambling task Punish contrast in the left hemisphere were overlaid with the white contours of areas 55b, FEF, andPEF from three participants with atypical 55b (HCP subjects 173940 and 770352, and CHCP subject 3040) and five participants with typical 55b. The white arrowspoint to areas that were incorrectly included in a specific parcel, while the gray arrows point to areas that should have been included in the parcel but were omitted.TS-AI-derived parcel boundaries demonstrated better correspondence with the task contrast maps compared to IMMP-based and registration-based parcel boundaries. ACH, anatomical connectivity homogeneity; FEF, frontal eye field; IMMP, individualized multimodal parcellation (Glasser et al. 2016); PCC, Pearson’s correlation coefficient; PEF, premotor eye field; Reference, the reference atlas aligned to the individual space; RFH, resting-state functional homogeneity; TAH, taskactivation homogeneity; WM, working memory. Two-tailed paired t-tests were performed between TS-AI and IMMP/Reference with Bonferroni correction for (b) (c)and FDR correction for (a) (d) (e). , p < 0.05; , p < 0.001.
图4. 使用HCP和独立CHCP数据集对TS-AI的验证。a. 使用核岭回归模型基于个性化Glasser图谱预测59个行为测量,涉及六个领域(n = 953)。通过双尾配对t检验比较了TS-AI和IMMP在每个领域和所有59个行为上的表现。结果显示,TS-AI在认知领域及所有测量的综合表现上显著优于IMMP。b 和 c. 在HCP重测数据(b, n = 39)和CHCP年轻(c, n = 221,年龄18–33岁)及老年参与者(c, n = 94,年龄48–79岁)中,TS-AI在解剖连接一致性和静息态功能一致性上显著高于基于配准的参考图谱和IMMP。d 和 e. 在HCP重测(d, n = 39)和CHCP年轻参与者(e, n = 160)的七项任务中,TS-AI在任务激活一致性上表现出显著优势。请注意,只有部分CHCP年轻参与者获得了tfMRI数据。f 和 g. HCP重测(f)和CHCP(g)数据中左半球语言任务故事对比和赌博任务惩罚对比的任务对比图与三名具有非典型55b区(HCP受试者173940和770352,以及CHCP受试者3040)和五名具有典型55b区的参与者的55b区、FEF区和PEF区的白色轮廓叠加。白色箭头指向在特定区域中被错误包含的区域,灰色箭头指向应包含在该区域但被遗漏的区域。与基于IMMP和配准的区域边界相比,TS-AI导出的区域边界与任务对比图展示了更好的对应性。ACH,解剖连接一致性;FEF,额眼场;IMMP,个性化多模态分区(Glasser 等, 2016);PCC,Pearson相关系数;PEF,前运动眼场;参考,参考图谱与个体空间对齐;RFH,静息态功能一致性;TAH,任务激活一致性;WM,工作记忆。TS-AI与IMMP/参考之间的双尾配对t检验使用了Bonferroni校正(b, c)和FDR校正(a, d, e)。,*p < 0.05;**,p* < 0.001。
Fig. 5. Sensitivity analyses of features contributing to the atlas individualizing sub-model. a. Modality-wise sensitivity map showing the contributing patterns ofeach modality to the atlas individualizing sub-model. Anatomical connectivity features exhibited high sensitivity in the lateral and medial frontal lobe, resting-statenetwork features showed high sensitivity in posteromedial cortices, and task activation features contributed mostly to the occipital and temporal lobes. Bright yellowrepresents regions with highly discriminating features. b. The averaged feature-wise sensitivity matrix for the left hemisphere across subjects in the HCP first-fold testset. The sensitivity maps below illustrate three exemplar columns, each corresponding to the sensitivity patterns of distinct features. c. The boxplots depict fiveexemplar rows from (b), namely area 55b, area 44, area 45, superior frontal language area (SFL), and perisylvian language area (PSL), showcasing varying sensitivities for different parcels in the language network. On the bottom of the boxes, the corresponding average feature maps are overlaid with the boundaries of theirrespective parcels. AC, anatomical connectivity; RSN, resting-state network.
图5. 对图谱个性化子模型中特征贡献的敏感性分析。a. 各模态的敏感性图,展示了每种模态对图谱个性化子模型的贡献模式。解剖连接特征在外侧和内侧额叶表现出较高的敏感性,静息态网络特征在后中央皮层显示出较高的敏感性,而任务激活特征主要对枕叶和颞叶贡献较大。亮黄色表示具有高度区分特征的区域。b. 在HCP第一折测试集中,所有受试者左半球的平均特征敏感性矩阵。下方的敏感性图展示了三个示例列,每列对应不同特征的敏感性模式。c. 箱线图展示了(b)中的五个示例行,即55b区、44区、45区、上额语言区(SFL)和外侧裂周围语言区(PSL),展示了语言网络中不同分区的敏感性差异。在箱线图下方,分别叠加了这些分区边界的平均特征图。AC,解剖连接;RSN,静息态网络。
Fig. 6. TS-AI applications in Alzheimer’s disease analyses. a. Compared to the registration-based reference atlas, TS-AI demonstrated significantly higher anatomicalconnectivity homogeneity and resting-state functional homogeneity for HC, MCI, and AD participants in ADNI dataset. b. The correlation between HC/MCI/ADgroups and normalized parcel loadings assessed using generalized linear models, regressing out covariates including age, sex, head motion, and total intracranialvolume. Blue and red parcels represent faster and slower shrinkage relative to the whole cortical surface from HC towards MCI and AD, respectively. The color barindicates T values. c. The map shows the regions with significant changes from HC, MCI to AD (FDR q < 0.05). d. The total normalized loadings of significantly fastershrinkage parcels (FDR q < 0.05 and T < 0, blue) and slower shrinkage parcels (FDR q < 0.05 and T > 0, red) for HC, MCI, and AD. e. The normalized loadings infaster shrinkage parcels exhibit a significant negative correlation with ADAS-Cog and FAQ, and a significant positive correlation with MoCA. No significant correlation was observed between normalized loadings in slower shrinkage parcels and ADAS-Cog, FAQ, and MoCA. The y-axes of the scatter plots represent measuresthat were normalized and regressed out covariates including age, sex, head motion, and total intracranial volume. 24dd, dorsal area 24d; 44, area 44; A4, auditory 4complex; EC, entorhinal cortex; FOP3, frontal opercular area 3; OFC, orbital frontal complex; p24, area posterior 24; p24pr, area posterior 24 prime; PeEc, perirhinalentorhinal cortex; PHA 1/2/3, parahippocampal area 1/2/3; PIT, posterior inferotemporal; STSda, area STSd anterior; STSdp, area STSd posterior; V3CD, area V3CD;VMV2, ventromedial visual area 2. , two-sample t-test Bonferroni corrected p < 0.001, n.s., not significant.
图6. TS-AI 在阿尔茨海默病(AD)分析中的应用。a. 与基于配准的参考图谱相比,TS-AI 在ADNI数据集中HC(健康对照)、MCI(轻度认知障碍)和AD(阿尔茨海默病)参与者中表现出显著更高的解剖连接一致性和静息态功能一致性。b. 使用广义线性模型评估HC/MCI/AD组与归一化分区负载的相关性,控制年龄、性别、头部运动和颅内总容量等协变量。蓝色和红色分区分别表示从HC到MCI和AD过程中相对于整个皮层表面更快或更慢的萎缩。颜色条表示T值。c. 该图展示了从HC到MCI再到AD过程中有显著变化的区域(FDR q < 0.05)。d. 对HC、MCI和AD组中显著更快萎缩分区(FDR q < 0.05 且 T < 0,蓝色)和更慢萎缩分区(FDR q < 0.05 且 T > 0,红色)的归一化总负载进行比较。e. 更快萎缩分区的归一化负载与ADAS-Cog和FAQ呈显著负相关,与MoCA呈显著正相关。更慢萎缩分区的归一化负载与ADAS-Cog、FAQ和MoCA之间未观察到显著相关性。散点图的y轴表示归一化的测量值,并控制了年龄、性别、头部运动和颅内总容量等协变量。24dd,背侧24d区;44,44区;A4,听觉4区;EC,内嗅皮层;FOP3,额叶操作区3;OFC,眶额复杂区;p24,后部24区;p24pr,后部24 prime区;PeEc,旁嗅皮层;PHA 1/2/3,海马旁区1/2/3;PIT,后部颞下区;STSda,前STS d区;STSdp,后STS d区;V3CD,V3CD区;VMV2,腹内侧视觉区2。双样本t检验,Bonferroni校正 p < 0.001,n.s.,无显著差异。
Table
表
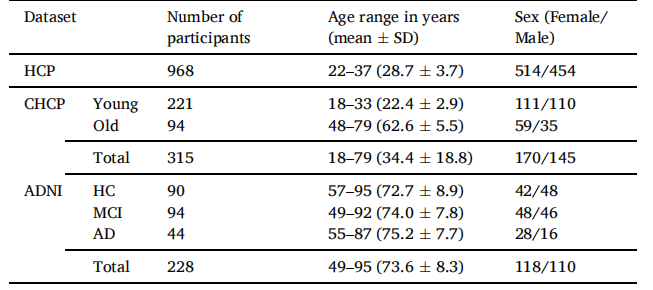
Table 1Demographic characteristics of HCP, CHCP, and ADNI used in this study
表1 本研究中使用的HCP、CHCP和ADNI数据集的人口统计特征。