目录
统计图
删除PPT页
from pptx import Presentation
from pptx.util import Cm, Inches, Mm, Pt
from pptx.dml.color import RGBColor
from pptx.chart.data import ChartData
from pptx.enum.chart import XL_CHART_TYPE, XL_LABEL_POSITION, XL_DATA_LABEL_POSITIONfile_path = r'C:\Users\Administrator\Desktop\testfile\测试文件\test.pptx'
prs = Presentation(file_path)  # 创建PPT文件对象,没有参数为创建新的PPT,有参数表示打开已有PPT文件对象
统计图
# 设置数据对象
ct = prs.slides[6].shapes
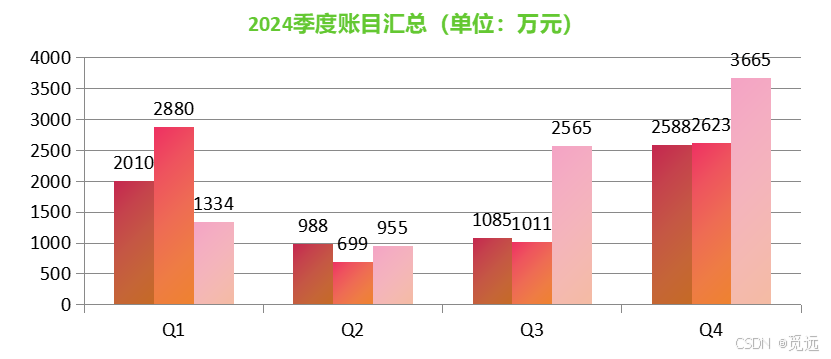
chart_data_x = ['Q1', 'Q2', 'Q3', 'Q4']
chart_data_y1 = [2010, 988, 1085, 2588]
chart_data_y2 = [2880, 699, 1011, 2623]
chart_data_y3 = [1334, 955, 2565, 3665]
chart_data = ChartData()
chart_data.categories = chart_data_x  # 设置横轴数据
chart_data.add_series(name='一厂', values=chart_data_y1)
chart_data.add_series(name='二厂', values=chart_data_y2)
chart_data.add_series(name='三厂', values=chart_data_y3)# 添加统计图
left, top, width, height = Cm(3), Cm(5), Cm(25), Cm(12)
# new_chart = ct.add_chart(chart_type=XL_CHART_TYPE.LINE, x=left, y=top, cx=width, cy=height, chart_data=chart_data)  # chart_type图表样式,LINE为折线图
new_chart = ct.add_chart(chart_type=XL_CHART_TYPE.COLUMN_CLUSTERED, x=left, y=top, cx=width, cy=height,chart_data=chart_data) # COLUMN_CLUSTERED为柱状图# 设置统计图标题样式和整体颜色风格
get_chart = new_chart.chart
get_chart.chart_style = 20  # 整体颜色风格(取值为1-48)
get_chart.has_title = True  # 设置标题
get_chart.chart_title.text_frame.clear()  # 清除原标题
new_tile = get_chart.chart_title.text_frame.add_paragraph()
new_tile.text = '2024季度账目汇总(单位:万元)'
new_tile.font.size = Pt(20)
new_tile.font.color.rgb = RGBColor(100, 200, 50)# 设置数据节点样式
plot = get_chart.plots[0]  # 获取图表的plot
plot.has_data_labels = True  # 统计图表节点上是否显示数据
p = plot.data_labels  # 数据标签控制类
p.font.size = Pt(5)  # 测试没有用!!
p.font.color.rgb = RGBColor(80, 200, 100)  # 测试没有用!!
p.position = XL_DATA_LABEL_POSITION.CENTER  # 设置数据位置,INSIDE_END\OUTSIDE_END 等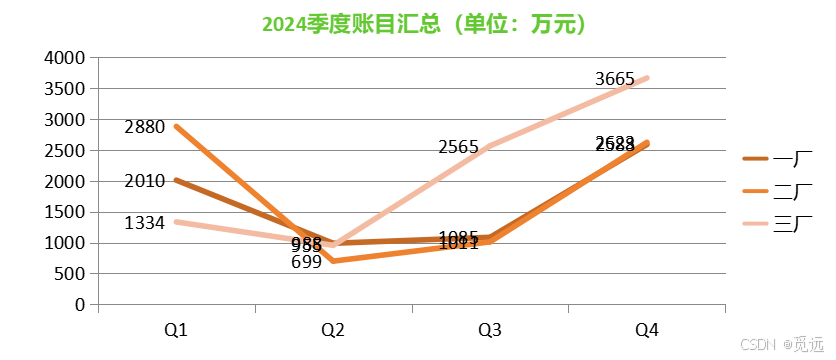
删除PPT页
page = list(prs.slides._sldIdLst)  # 获取ppt页列表,slides 对象的源码中有私有属性sldIdLst指向幻灯片元素集合,获取幻灯片页数
prs.slides._sldIdLst.remove(page[-2])  # 删除指定页

![[每周一更]-(第122期):模拟面试|数据库面试思路解析](https://i-blog.csdnimg.cn/direct/098c243aa4f046adafc70b77c0b02667.jpeg#pic_center)

