[论文精读]Graph Neural Network-Based Anomaly Detection in Multivariate Time Series

论文网址:[2106.06947] Graph Neural Network-Based Anomaly Detection in Multivariate Time Series (arxiv.org)

论文代码:https://github.com/d-ailin/GDN

英文是纯手打的!论文原文的summarizing and paraphrasing。可能会出现难以避免的拼写错误和语法错误,若有发现欢迎评论指正!文章偏向于笔记,谨慎食用

目录

1. 省流版

1.1. 心得

2. 论文逐段精读

2.1. Abstract

2.2. Introduction

2.3. Related Work

2.4. Proposed Framework

2.4.1. Problem Statement

2.4.2. Overview

2.4.3. Sensor Embedding

2.4.4. Graph Structure Learning

2.4.5. Graph Attention-Based Forecasting

2.4.6. Graph Deviation Scoring

2.5. Experiments

2.5.1. Datasets

2.5.2. Baselines

2.5.3. Evaluation Metrics

2.5.4. Experimental Setup

2.5.5. RQ1. Accuracy

2.5.6. RQ2. Ablation

2.5.7. RQ3. Interpretability of Model

2.5.8. RQ4. Localizing Anomalies

2.6. Conclusion

3. Reference


1. 省流版

1.1. 心得

(1)还行还行,其实是比较简单的模型,而且介绍的非常清晰,而且有代码,看一下也不算亏

2. 论文逐段精读

2.1. Abstract

        ①Existing work: high-dimensional data solving improved by deep learning

        ②Challenge: existing methods do not explicitly learn the structure of existing relationships between variables

2.2. Introduction

        ①Mostly plenty of sensors help to anomaly detect

        ②Anomaly detection usually be classified as un-supervised problem due to the anomalies are unlabeled and variable

        ③They proposed Graph Deviation Network (GDN)

2.3. Related Work

(1)Anomaly Detection

        ①Methods are autoencoders (AE) and VAE as so on

(2)Multivariate Time Series Modelling

         ①This method models behavior of a multivariate time series based on its past behavior, including auto-regressive models, auto-regressive integrated moving average (ARIMA) models, CNN, LSTM, and GAN. However, it is difficult for them to handle complex and highly non-stationary time series.

(3)Graph Neural Networks

        ①Limited in multi sensor representation and unknown original graph structure

2.4. Proposed Framework

2.4.1. Problem Statement

        ①Number of sensors: N

        ②Pattern of data: time series \mathbf{s}_{\mathrm{train}}=\left[\mathbf{s}_{\mathrm{train}}^{(1)},\cdots,\mathbf{s}_{\mathrm{train}}^{(T_{\mathrm{train}})}\right],\mathbf{s}_{\mathrm{train}}^{(t)} \in \mathbb{R}^{N}, it means each data comes from a sensor

        ③Time passing: T_{train}

        ④Training data: only normal data

        ⑤Testing method: got data from N sensors but only separate set of T_{test} time ticks \mathbf{s}_{\mathrm{test}}=\begin{bmatrix}\mathbf{s}_{\mathrm{test}}^{(1)},\cdots,\mathbf{s}_{\mathrm{test}}^{(T_{\mathrm{test}})}\end{bmatrix}

        ⑥Output: list/array in T_{test} length with binary result, \mathsf{a}(t)\in\{0,1\} where 1 indicate anomalous

2.4.2. Overview

        ①List the following four parts

        ②Overall framework:

2.4.3. Sensor Embedding

        ①Representation of each sensor: \mathbf{v_{i}}\in\mathbb{R}^{d},\mathrm{~for~}i\in\{1,2,\cdots,N\}

2.4.4. Graph Structure Learning

        ①Graph construction: directed graph applied

        ②Nodes: sensors

        ③Edges: dependency relationships (An edge from one sensor to another indicates that the first sensor is used for modelling the behavior of the second sensor)

        ④Adjacency matrix: A

        ⑤Prior information represented by candidate relations:

\mathcal{C}_i\subseteq\{1,2,\cdots,N\}\setminus\{i\}

if there is no prior information, the candidate relations of sensor i  is all the sensor except for i itself

        ⑥Sensor similarity:

\begin{aligned}&e_{ji}=\frac{\mathbf{v_{i}}^{\top}\mathbf{v_{j}}}{\|\mathbf{v_{i}}\|\cdot\|\mathbf{v_{j}}\|}\mathrm{~for~}j\in\mathcal{C}_{i}\\&A_{ji}=1\{j\in\mathsf{TopK}(\{e_{ki}:k\in\mathcal{C}_{i}\})\}\end{aligned}

the edge is calculated by the cosine similarity fomular and they select the top k similar one

2.4.5. Graph Attention-Based Forecasting

        ①Predicted/expected action at time t based on the input:

\mathbf{x^{(t)}}:=\begin{bmatrix}\mathbf{s^{(t-w)}},\mathbf{s^{(t-w+1)}},\cdots,\mathbf{s^{(t-1)}}\end{bmatrix}, \mathbf{x^{(t)}}\in\mathbb{R}^{N\times w}

where w denotes the size of sliding window, they need to predict the information \mathbf{s^{(t)}}

(1)Feature Extractor

        ①Aggregation methods:

\mathbf{z}_{i}^{(t)}=\mathrm{ReLU}\left(\alpha_{i,i}\mathbf{W}\mathbf{x}_{i}^{(t)}+\sum_{j\in\mathcal{N}(i)}\alpha_{i,j}\mathbf{W}\mathbf{x}_{j}^{(t)}\right)

where \alpha_{i,i} are attention coefficients and they are calculated by:

\begin{aligned} \mathbf{g}_{i}^{(t)}& =\mathbf{v}_{i}\oplus\mathbf{Wx}_{i}^{(t)} \\ \pi\left(i,j\right)& =\mathrm{LeakyReLU}\left(\mathbf{a}^{\top}\left(\mathbf{g}_{i}^{(t)}\oplus\mathbf{g}_{j}^{(t)}\right)\right) \\ \alpha_{i,j}& =\frac{\exp\left(\pi\left(i,j\right)\right)}{\sum_{k\in\mathcal{N}(i)\cup\{i\}}\exp\left(\pi\left(i,k\right)\right)}, \end{aligned}

where \bigoplus denotes concatenation, \mathbf{a} denotes the vector of learned coefficients for
the attention mechanism

(2)Output Layer

        ①New features obtained of each nodes: \{\mathbf{z}_{1}^{(t)},\cdots,\mathbf{z}_{N}^{(t)}\}

        ②Predicted value at time t:

\mathbf{\hat{s}}^{(\mathbf{t})}=f_\theta\left(\begin{bmatrix}\mathbf{v}_1\circ\mathbf{z}_1^{(t)},\cdots,\mathbf{v}_N\circ\mathbf{z}_N^{(t)}\end{bmatrix}\right)

where \circ denotes element-wise multiply and f is the fully connected layer

        ③Loss function (MSE):

L_{\mathrm{MSE}}=\frac{1}{T_{\mathrm{train}}-w}\sum_{t=w+1}^{T_{\mathrm{train}}}\left\|\mathbf{\hat{s}}^{(\mathbf{t})}-\mathbf{s}^{(\mathbf{t})}\right\|_{2}^{2}

2.4.6. Graph Deviation Scoring

        ①The error valure of sensor i at time t:

\mathsf{Err}_i(t)=|\mathbf{s_i^{(t)}}-\mathbf{\hat{s}_i^{(t)}}|

        ②To attenuate the influence of single sensor, they normalize the error:

a_i\left(t\right)=\frac{\mathsf{Err}_i\left(t\right)-\widetilde{\mu}_i}{\widetilde{\sigma}_i}

where \widetilde{\mu}_i is the median and \widetilde{\sigma}_i denotes the inter-quartile range (IQR2) at time t. ⭐作者认为中位数和IQR比平均值和标准差更robust

        ③Overall anomalousness at time t:

A\left(t\right)=\max_{i}a_{i}\left(t\right)

作者解释说使用max是因为异常可能只影响一小部分传感器,甚至单个传感器...不一定吧???感觉得分情况

        ④Generating smoothed score A_{s}\left(t\right) by simple moving average(SMA)

        ⑤Threshold of anomaly: the maximum value over the validation data.

2.5. Experiments

2.5.1. Datasets

        ①Datasets: The Secure Water Treatment (SWaT) and Water Distribution (WADI)

        ②Statistics of 2 datasets:

        ③Sampling interval: 10 s

        ④Filtering: eliminate the first 2106 samples form the two dataset cuz the systems took 5-6 hours to reach stabilization when first turned on

2.5.2. Baselines

        ①Briefly introduce PCA, KNN, FB, AE, DAGMM, LSTM-VAE, MAD-GAN

2.5.3. Evaluation Metrics

        ①Metrics: precision (Prec), recall (Rec) and F1-Score (F1)

2.5.4. Experimental Setup

        ①Optimizer: Adam

        ②Learning rate: 1e-3

        ③Hyper-parameters: \beta _1=0.9,\beta _2=0.99

        ④Epoch: 50 with early stop in 10

        ⑤k=30 in WADI and  k=15 in SWaT 

        ⑥Sliding window size w=5

2.5.5. RQ1. Accuracy

        ①Comparison table:

2.5.6. RQ2. Ablation

        ①Ablation studies with static complete graph applied, w/o sensor embedding and w/o attention:

2.5.7. RQ3. Interpretability of Model

(1)Interpretability via Sensor Embeddings

        ①Embedding similarity between sensors via t-SNE:

where the 7 colors are 7 classes

(2)Interpretability via Graph Edges and Attention Weights

        ①Correlated sensors in WADI:

drawn by force-directed layout. where the red lines are the largest deviation

2.5.8. RQ4. Localizing Anomalies

        ①Visualization of prediction and reality:

        ②Their contributions: localize anomalies, find most related sensor, and visualize how the deviate from expectations

2.6. Conclusion

        ~

3. Reference

Deng, A. & Hooi, B. (2021) 'Graph Neural Network-Based Anomaly Detection in Multivariate Time Series', AAAI.

本文来自互联网用户投稿,该文观点仅代表作者本人,不代表本站立场。本站仅提供信息存储空间服务,不拥有所有权,不承担相关法律责任。如若转载,请注明出处:http://www.xdnf.cn/news/1535763.html

如若内容造成侵权/违法违规/事实不符,请联系一条长河网进行投诉反馈,一经查实,立即删除!

相关文章

java的内存分配和回收机制

Java 与 C之间有一堵由内存动态分配和垃圾收集技术所围成的高墙,墙外面的人想进去,墙里面的人却想出来。 概述 垃圾收集(GC)需要完成的三件事情: 哪些内存需要回收?什么时候回收?如何回收&am…

4个方法教你图片转PDF怎么弄。

我们有时候会接触了一些重要的图片文件或者资料,想要装换成可编辑的PDF格式,更方便自己管理。这时候就会需要转换的工具,我这里就有4款可以完成这种转换的高效工具可以分享给大家。 1、365PDF转换软件 直通车:www.pdf…

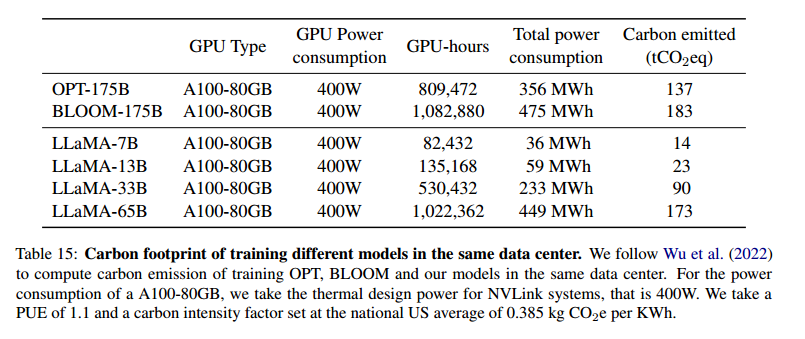
速通LLaMA1:《LLaMA: Open and Efficient Foundation Language Models》全文解读

文章目录 论文总览1. 创新点和突破点2. 技术实现与算法创新3. 架构升级4. 概念补充SwiGLU激活函数AdamW 5. 总结 AbstractIntroductionApproachPre-training DataArchitecture(架构)Optimizer(优化器)Efficient implementation&am…

[网络]https的概念及加密过程

文章目录 一. HTTPS二. https加密过程 一. HTTPS https本质上就是http的基础上增加了一个加密层, 抛开加密之后, 剩下的就是个http是一样的 s > SSL HTTPS HTTP SSL 这个过程, 涉及到密码学的几个核心概念 明文 要传输的真正意思是啥 2)密文 加密之后得到的数据 这个密文…

循环练习 案例

swich新特性 jdk12 穿透 逢七过 //含有七和被七整除舍去 public class test1 {public static void main(String[] args){for (int i 1; i <100 ; i) {if(i%70||i%107||i/107){continue;}System.out.println(i);}} } 求平方根 //输入大于2的整数&#xff0c;求平方根&…

linux---压缩打包

linux打包和压缩文件和目录&#xff1a; 归档(打包)命令&#xff1a;tar 归档就是将多个文件或者目录打包成为一个文件&#xff0c;存放再磁盘中&#xff0c;方便文件或者目录丢失时&#xff0c;可以恢复。 归档文件名使用相对路径 &#xff08;注意区分归档文件和被归档文…

LAMP+WordPress

一、简介 LAMP&#xff1a; L&#xff1a;linux——操作系统&#xff0c;提供服务器运行的基础环境。A&#xff1a;apache&#xff08;httpd&#xff09;——网页服务器软件&#xff0c;负责处理HTTP请求和提供网页内容。M&#xff1a;mysql&#xff0c;mariadb——数据库管理…

【网络安全的神秘世界】攻防环境搭建及漏洞原理学习

&#x1f31d;博客主页&#xff1a;泥菩萨 &#x1f496;专栏&#xff1a;Linux探索之旅 | 网络安全的神秘世界 | 专接本 | 每天学会一个渗透测试工具 Kali安装docker 安装教程 PHP攻防环境搭建 中间件 介于应用系统和系统软件之间的软件。 能为多种应用程序合作互通、资源…

JavaScript高级——作用域和作用链

1、概念理解&#xff1a; —— 就是一块“地盘”&#xff0c;一个代码所在的区域 —— 静态的&#xff08;相对于上下文对象&#xff09;&#xff0c;在编写代码时就确定了 2、分类 ① 全局作用域 ② 函数作用域 ③ 没有块作用域&#xff08;ES6有了&#xff09; 3、作用 …

828华为云征文 | 云服务器Flexus X实例:多智能体对话框架 AutoGen 部署和实例运行

目录 一、什么是多智能体&#xff1f; 二、什么是 AutoGen&#xff1f; 三、部署 AutoGen 3.1 更新 apt 软件源 3.2 安装 python 3.10 3.3 安装 AutoGen 3.4 安装 AutoGen Studio 四、运行 AutoGen Studio 五、实例展示 5.1 构建实例 5.2 运行 六、总结 在体验了华为…

第 13 章 兵马未动,粮草先行——InnoDB 统计数据是如何收集的

表的统计数据&#xff1a;SHOW TABLE STATUS LIKE table_name; 索引的统计数据&#xff1a;SHOW INDEX FROM table_name; 13.1 两种不同的统计数据存储方式 InnoDB 提供了两种存储统计数据的方式&#xff1a; 永久性的统计数据。存储在磁盘上&#xff0c;服务器重启之后还在…

上图为是否色发

&#x1f4e2;博客主页&#xff1a;https://blog.csdn.net/2301_779549673 &#x1f4e2;欢迎点赞 &#x1f44d; 收藏 ⭐留言 &#x1f4dd; 如有错误敬请指正&#xff01; &#x1f4e2;本文由 JohnKi 原创&#xff0c;首发于 CSDN&#x1f649; &#x1f4e2;未来很长&#…

利士策分享,深耕一事:解锁专注秘诀

利士策分享&#xff0c;深耕一事&#xff1a;解锁专注秘诀 在信息洪流与诱惑交织的时代&#xff0c;专注成为稀缺能力。 我们常被社交媒体、工作邮件和琐事分散注意力&#xff0c;难以集中。 然而&#xff0c;专注是实现个人成长、职业发展和生活目标的基石。 要提升专注力&…

SSM网上书店管理系统---附源码72542

目 录 摘要 1 绪论 1.1 研究背景及意义 1.2国内外研究现状 1.3系统开发的目标 1.4论文结构与章节安排 2 网上书店管理系统系统分析 2.1 可行性分析 2.1.1 技术可行性分析 2.1.2 经济可行性分析 2.1.3 操作可行性分析 2.2 系统功能分析 2.2.1 功能性分析 2.2.2 非…

Docker安装mysql安装nginx安装Redis

Docker安装mysql 下载镜像 docker pull mysql:8.0注意,使用此方法安装镜像需要提前配置镜像源,详情看之前的文章 安装 docker run -d -p 3306:3306 \ --name mysql \ --restartalways \ --privilegedtrue \ -e TZAsia/Shanghai \ -e MYSQL_ROOT_PASSWORDroot \ mysql:8.0进…

【漏洞复现】用友 U8-cloud ActionServlet sql注入漏洞

产品介绍 用友U8 CRM客户关系管理系统是一款专业的企业级CRM软件&#xff0c;旨在帮助企业高效管理客户关系、提升销售业绩和提供优质的客户服务。 漏洞描述 用友 U8-cloud ActionServlet 接口存在一个 SQL 注入漏洞&#xff0c;通过这个漏洞可以操纵服务器的数据库。这意味…

Protubuf入门

⼀、初识 ProtoBuf 1. 序列化概念 序列化和反序列化 序列化&#xff1a;把对象转换为字节序列的过程 称为对象的序列化。 反序列化&#xff1a;把字节序列恢复为对象的过程 称为对象的反序列化。 什么情况下需要序列化 存储数据&#xff1a;当你想把的内存中的对象状态…

AtCoder ABC369 A-D题解

比赛链接:ABC369 省流&#xff1a;A<B<D<C&#xff08;题解是按照该顺序写的&#xff09; Problem A: #include <bist/stdc.h> using namespace std; int main(){int A,B;cin>>A>>B;if(AB)cout<<1<<endl;else if(abs(A-B)%20)cout&l…

基于Web的《药谷奇遇记》网站设计与实现---附源码72940

目 录 1 绪论 1.1 研究背景与意义 1.2国内外研究现状 1.3论文结构与章节安排 2 系统分析 2.1 可行性分析 2.1.1 技术可行性分析 2.1.2 经济可行性分析 2.1.3 法律可行性分析 2.2 系统功能分析 2.2.1 功能性分析 2.2.2 非功能性分析 2.3 系统用例分析 2.4 系统流程…

【Qt绘图】—— 运用Qt进行绘图

目录 &#xff08;一&#xff09;基本概念 &#xff08;二&#xff09;绘制各种形状 2.1 绘制线段 2.2 绘制矩形 2.3 绘制圆形 2.4 绘制文本 2.5 设置画笔 2.6 设置画刷 &#xff08;三&#xff09;绘制图片 3.1 绘制简单图片 3.2 平移图片 3.3 缩放图片 3.4…