文章目录
- 1 node rules
- 2 nginx rule
- 2.1 Nginx 4xx 错误率太多
- 2.2 Nginx 5xx 错误率太多
- 2.3 Nginx 延迟高
- 3 mysql rule
- 3.1 MySQL 宕机
- 3.2 实例连接数过多
- 3.3 MySQL高线程运行
- 3.4 MySQL 从服务器 IO 线程没有运行
- 3.5 MySQL 从服务器 SQL 线程没有运行
- 3.6 MySQL复制滞后
- 3.7 慢查询
- 3.8 innodb 日志写入停滞
- 3.9 MySQL 实例 1 分钟内重启过
- 3.10 完成配置
- 4 redis rule
- 4.1 Redis down
- 4.2 Redis missing master
- 4.3 Redis too many masters
- 4.4 Redis disconnected slaves
- 4.5 Redis replication broken Redis 复制已中断
- 4.6 Redis cluster flapping Redis群集摆动
- 4.7 Redis missing backup
- 4.8 Redis out of system memory
- 4.9 Redis out of configured maxmemory
- 4.10 Redis too many connections
- 4.11 Redis not enough connections
- 4.12 Redis rejected connections
- 4.13 完整规则文件
- 5 rabbitmq rule [rabbitmq/rabbitmq-prometheus](https://github.com/rabbitmq/rabbitmq-prometheus)
- 5.1 Rabbitmq node down
- 5.2 Rabbitmq node not distributed
- 5.3 Rabbitmq instances different versions
- 5.4 Rabbitmq memory high
- 5.5 Rabbitmq file descriptors usage
- 5.6 Rabbitmq too many unack messages
- 5.7 Rabbitmq too many connections
- 5.8 Rabbitmq no queue consumer
- 5.9 Rabbitmq unroutable messages
- 6 minio rule
- 7 postgresql
- 7.1 Postgresql down
- 7.2 Postgresql restarted
- 7.3 Postgresql exporter error
- 7.4 Postgresql table not auto vacuumed
- 7.5 Postgresql table not auto analyzed
- 7.6 Postgresql too many connections
- 7.7 Postgresql not enough connections
- 7.8 Postgresql dead locks
- 7.9 Postgresql high rollback rate
- 7.10 Postgresql commit rate low
- 7.11 Postgresql low XID consumption
- 7.12 Postgresql high rate statement timeout
- 7.13 Postgresql high rate deadlock
- 7.14 Postgresql unused replication slot
- 7.15 Postgresql too many dead tuples
- 7.16 Postgresql SSL compression active
- 7.17 Postgresql too many locks acquired
- 7.18 Postgresql bloat index high (> 80%)
- 7.19 Postgresql bloat table high (> 80%)
- 7.20 完整规则
- 8 kafka rule
- 9 keepalived rule
1 node rules
groups:- name: noderules:# 服务器节点不可用- alert: NodeDownexpr: up == 0for: 20slabels:severity: criticalannotations:summary: "{{ $labels.instance }}: down"description: "{{ $labels.instance }} has been down for more than 3m"value: "{{ $value }}"- alert: NodeCPUHigh# 节点 CPU 5 分钟的平均负载 过高,大于 75%expr: (1 - avg by (instance) (irate(node_cpu_seconds_total{mode="idle"}[5m]))) * 100 > 75for: 5mlabels:severity: warningannotations:summary: "{{$labels.instance}}: High CPU usage"description: "{{$labels.instance}}: CPU usage is above 75%"value: "{{ $value }}"- alert: NodeCPUIowaitHigh# 节点 5 分钟内的CPU iowait 过高,大于 50expr: avg by (instance) (irate(node_cpu_seconds_total{mode="iowait"}[5m])) * 100 > 50for: 5mlabels:severity: warningannotations:summary: "{{$labels.instance}}: High CPU iowait usage"description: "{{$labels.instance}}: CPU iowait usage is above 50%"value: "{{ $value }}"- alert: NodeMemoryUsageHigh# 节点内存使用率太高,大于 90%# node_memory_MemAvailable_bytes / node_memory_MemTotal_bytes 得出当前可用率# 1 - 当前可用率 得出已经使用率# (1 - 当前可用率) * 100 得出当前已使用百分比expr: (1 - node_memory_MemAvailable_bytes / node_memory_MemTotal_bytes) * 100 > 90for: 5mlabels:severity: warningannotations:summary: "{{$labels.instance}}: High memory usage"description: "{{$labels.instance}}: Memory usage is above 90%"value: "{{ $value }}"- alert: NodeDiskRootLow# 根分区可用率太低,小于 20%# node_filesystem_avail_bytes{fstype=~"ext.*|xfs",mountpoint ="/"} / node_filesystem_size_bytes{fstype=~"ext.*|xfs",mountpoint ="/"} 得出根分区容量可用率expr: node_filesystem_avail_bytes{fstype=~"ext.*|xfs",mountpoint ="/"} / node_filesystem_size_bytes{fstype=~"ext.*|xfs",mountpoint ="/"} * 100 > 20for: 10mlabels:severity: warningannotations:summary: "{{$labels.instance}}: Low disk(the / partition) space"description: "{{$labels.instance}}: 根分区可用率低于 20%,当前值:{{ $value }}"- alert: NodeLoad5Highexpr: (node_load5) > (count by (instance) (node_cpu_seconds_total{mode='system'}) * 2)for: 5mlabels:severity: warningannotations:summary: "{{$labels.instance}}: Load(5m) High"description: "{{$labels.instance}}: Load(5m) is 2 times the number of CPU cores"value: "{{ $value }}"2 nginx rule
依赖
2.1 Nginx 4xx 错误率太多
- alert: NginxHighHttp4xxErrorRateexpr: sum(rate(nginx_http_requests_total{status=~"^4.."}[1m])) / sum(rate(nginx_http_requests_total[1m])) * 100 > 5for: 1mlabels:severity: criticalannotations:summary: Nginx 状态码 4xx 错误率高 (实例: {{ $labels.instance }})description: "HTTP 状态码为 4xx 的过多 (> 5%)\n 当前值:{{ $value }}\n 标签:{{ $labels }}"2.2 Nginx 5xx 错误率太多
- alert: NginxHighHttp5xxErrorRateexpr: sum(rate(nginx_http_requests_total{status=~"^5.."}[1m])) / sum(rate(nginx_http_requests_total[1m])) * 100 > 5for: 1mlabels:severity: criticalannotations:summary: Nginx 状态码 5xx 错误率高 (实例: {{ $labels.instance }})description: "HTTP 状态码为 5xx 的过多 (> 5%)\n 当前值:{{ $value }}\n 标签:{{ $labels }}"2.3 Nginx 延迟高
- alert: NginxLatencyHighexpr: histogram_quantile(0.99, sum(rate(nginx_http_request_duration_seconds_bucket[2m])) by (host, node, le)) > 3for: 2mlabels:severity: warningannotations:summary: Nginx延迟高 (实例:{{ $labels.instance }})description: "Nginx p99延迟高于3秒\n 当前值:{{ $value }}\n 标签:{{ $labels }}"3 mysql rule
3.1 MySQL 宕机
- alert: MysqlDownexpr: mysql_up == 0for: 0mlabels:severity: criticalannotations:summary: MySQL ({{ $labels.instance }}) is down description: "MySQL 挂了: {{ $labels.instance }}\n 当前值:{{ $value }}\n 标签:{{ $labels }}"3.2 实例连接数过多
{{ $labels.instance }}上使用了超过80%的MySQL连接。
- alert: MysqlTooManyConnections(>80%)expr: max_over_time(mysql_global_status_threads_connected[1m]) / mysql_global_variables_max_connections * 100 > 80for: 2mlabels:severity: warningannotations:summary: MySQL too many connections (> 80%) (instance {{ $labels.instance }})description: "{{ $labels.proj }}MySQL 的连接数超过了允许的 80% {{ $labels.instance }}\n 当前值:{{ $value }}\n 标签:{{ $labels }}"3.3 MySQL高线程运行
上超过60%的MySQL连接处于运行状态
- alert: MysqlHighThreadsRunningexpr: max_over_time(mysql_global_status_threads_running[1m]) / mysql_global_variables_max_connections * 100 > 60for: 2mlabels:severity: warningannotations:summary: MySQL high threads running (instance {{ $labels.instance }})description: "超过60%的MySQL连接在 {{ $labels.instance }} 上处于运行状态\n 当前值:{{ $value }}\n 标签:{{ $labels }}}"3.4 MySQL 从服务器 IO 线程没有运行
- alert: MysqlSlaveIoThreadNotRunningexpr: ( mysql_slave_status_slave_io_running and ON (instance) mysql_slave_status_master_server_id > 0 ) == 0for: 0mlabels:severity: criticalannotations:summary: MySQL Slave IO thread not running (instance {{ $labels.instance }})description: "MySQL Slave IO线程未在{{ $labels.instance }} 上运行 \n 当前值:{{ $value }}\n 标签:{{ $labels }}"3.5 MySQL 从服务器 SQL 线程没有运行
- alert: MysqlSlaveSqlThreadNotRunningexpr: ( mysql_slave_status_slave_sql_running and ON (instance) mysql_slave_status_master_server_id > 0) == 0for: 0mlabels:severity: criticalannotations:summary: MySQL Slave SQL thread not running (instance {{ $labels.instance }})description: "MySQL {{ $labels.instance }} 的 Slave SQL 线程没有运行。\n 当前值:{{ $value }}\n 标签:{{ $labels }}"3.6 MySQL复制滞后
就是 主节点的二级制事务太多的时候,从节点复制的过慢;
或者当我们从一个之前备份的主节点的数据导入到某个从节点时候,也会出现这样的情况,因为此时从节点是从导入数据的那个时候的二级制位置开始复制的,但是此时 主节点的实际二级制位置要新。
这个 mysql_slave_status_seconds_behind_master 是执行命令 show salve status\G 返回结果中的 Seconds_Behind_Master 的值;
而 mysql_slave_status_sql_delay 是 SQL_Delay 的值。
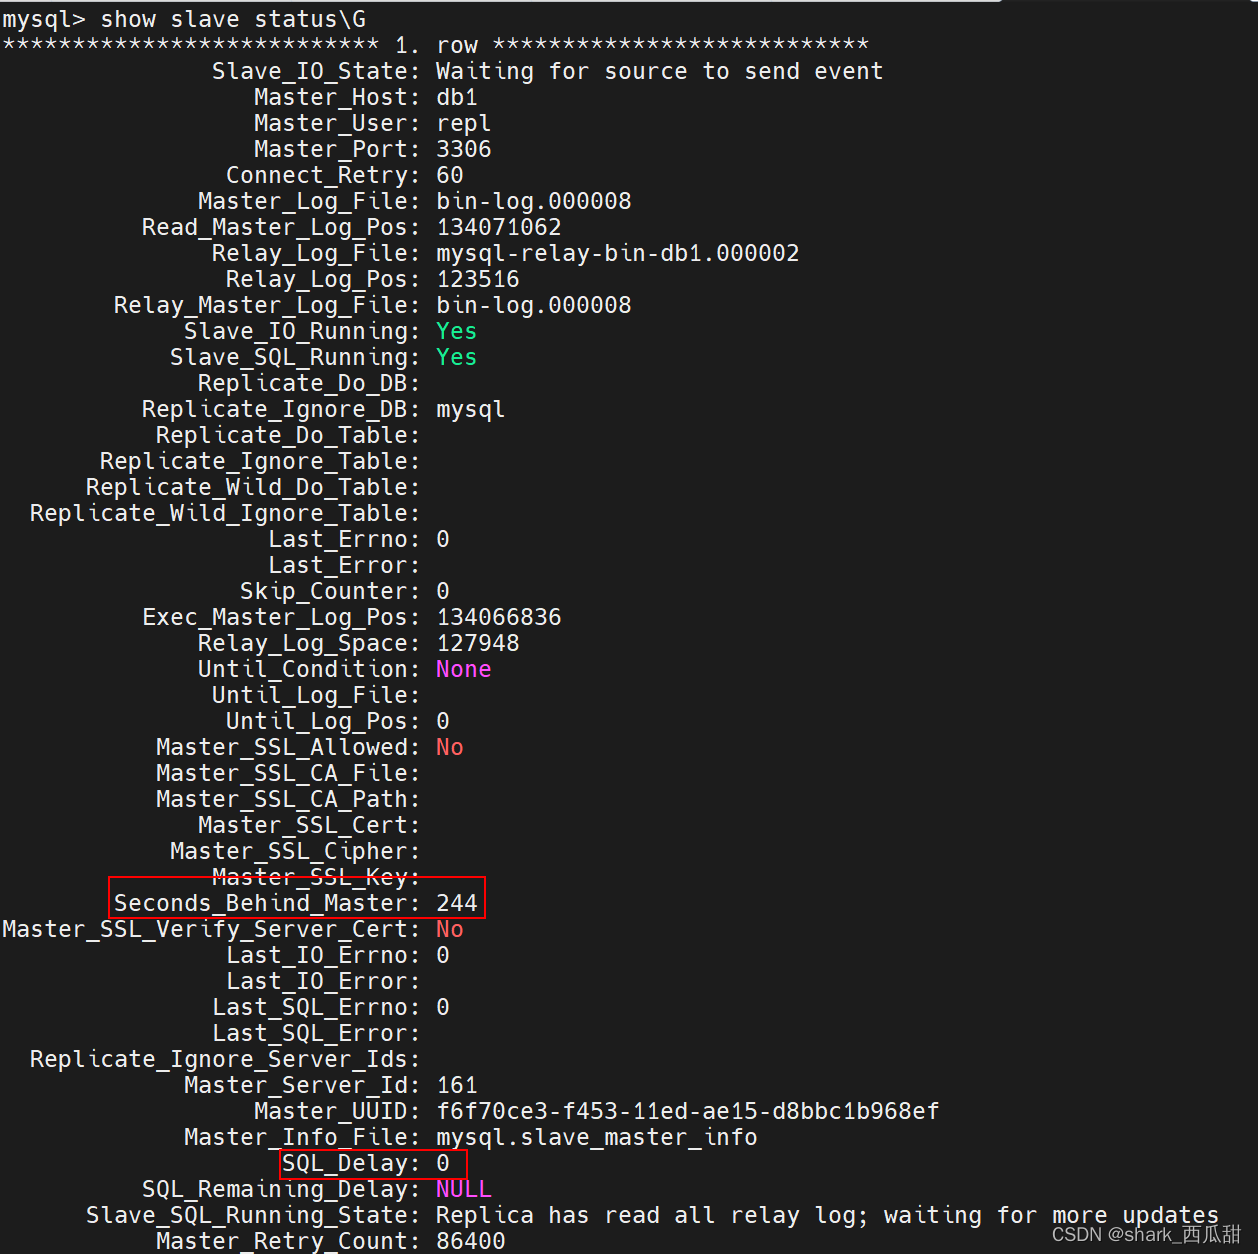
- alert: MysqlSlaveReplicationLagexpr: ( (mysql_slave_status_seconds_behind_master - mysql_slave_status_sql_delay) and ON (instance) mysql_slave_status_master_server_id > 0 ) > 30for: 1mlabels:severity: criticalannotations:summary: MySQL Slave replication lag (instance {{ $labels.instance }})description: "MySQL 复制滞后了 \n 当前值:{{ $value }}\n 标签:{{ $labels }}"3.7 慢查询
MySQL服务器有新的慢速查询。
- alert: MysqlSlowQueriesexpr: increase(mysql_global_status_slow_queries[1m]) > 0for: 2mlabels:severity: warningannotations:summary: MySQL slow queries (instance {{ $labels.instance }})description: "MySQL 有一些新的慢查询.\n 当前值:{{ $value }}\n 标签:{{ $labels }}"
3.8 innodb 日志写入停滞
MySQL innodb日志写入停滞
- alert: MysqlInnodbLogWaitsexpr: rate(mysql_global_status_innodb_log_waits[15m]) > 10for: 0mlabels:severity: warningannotations:summary: MySQL restarted (instance {{ $labels.instance }})description: "MySQL innodb日志正在以 {{ $value }}/秒的速率等待写入磁盘\n 标签:{{ $labels }}"3.9 MySQL 实例 1 分钟内重启过
实例 {{ $labels.instance }} 上的MySQL刚刚在一分钟内重启过。
- alert: MysqlRestartedexpr: mysql_global_status_uptime < 60for: 0mlabels:severity: infoannotations:summary: MySQL restarted (实例: {{ $labels.instance }})description: "MySQL 实例 {{ $labels.instance }} 1 分钟内刚刚重启.\n 当前值:{{ $value }}\n 标签:{{ $labels }}"3.10 完成配置
groups:
- name: MySQLAlertsrules:- alert: MysqlDownexpr: mysql_up == 0for: 0mlabels:severity: criticalannotations:summary: MySQL down (实例: {{ $labels.instance }})description: "MySQL 挂了: {{ $labels.instance }}\n  当前值:{{ $value }}\n  标签:{{ $labels }}"# `{{ $labels.instance }}`上使用了超过80%的MySQL连接。- alert: MysqlTooManyConnections(>80%)expr: max_over_time(mysql_global_status_threads_connected[1m]) / mysql_global_variables_max_connections * 100 > 80for: 2mlabels:severity: warningannotations:summary: MySQL 连接数过多 (> 80%) (实例: {{ $labels.instance }})description: "{{ $labels.proj }}MySQL 的连接数超过了允许的 80% {{ $labels.instance }}\n  当前值:{{ $value }}\n  标签:{{ $labels }}"# 上超过60%的MySQL连接处于运行状态- alert: MysqlHighThreadsRunningexpr: max_over_time(mysql_global_status_threads_running[1m]) / mysql_global_variables_max_connections * 100 > 60for: 2mlabels:severity: warningannotations:summary: MySQL 正处于高线程运行中 (实例: {{ $labels.instance }})description: "超过60%的MySQL连接在 {{ $labels.instance }} 上处于运行状态\n  当前值:{{ $value }}\n  标签:{{ $labels }}}"# MySQL 从服务器 IO 线程没有运行- alert: MysqlSlaveIoThreadNotRunningexpr: ( mysql_slave_status_slave_io_running and ON (instance) mysql_slave_status_master_server_id > 0 ) == 0for: 0mlabels:severity: criticalannotations:summary: MySQL Slave IO thread 没有运行 (实例: {{ $labels.instance }})description: "MySQL Slave IO线程未在{{ $labels.instance }} 上运行 \n  当前值:{{ $value }}\n  标签:{{ $labels }}"# MySQL 从服务器 SQL 线程没有运行- alert: MysqlSlaveSqlThreadNotRunningexpr: ( mysql_slave_status_slave_sql_running and ON (instance) mysql_slave_status_master_server_id > 0) == 0for: 0mlabels:severity: criticalannotations:summary: Slave SQL 线程没有运行 (实例: {{ $labels.instance }})description: "MySQL {{ $labels.instance }} 的 Slave SQL 线程没有运行。\n  当前值:{{ $value }}\n  标签:{{ $labels }}"# MySQL复制滞后- alert: MysqlSlaveReplicationLagexpr: ( (mysql_slave_status_seconds_behind_master - mysql_slave_status_sql_delay) and ON (instance) mysql_slave_status_master_server_id > 0 ) > 30for: 1mlabels:severity: criticalannotations:summary: MySQL复制滞后 (实例: {{ $labels.instance }})description: "MySQL 复制滞后了 \n  当前值:{{ $value }}\n  标签:{{ $labels }}"# MySQL服务器有新的慢速查询。- alert: MysqlSlowQueriesexpr: increase(mysql_global_status_slow_queries[1m]) > 0for: 2mlabels:severity: warningannotations:summary: MySQL 慢查询 (实例: {{ $labels.instance }})description: "MySQL 有一些新的慢查询.\n  当前值:{{ $value }}\n  标签:{{ $labels }}"# MySQL innodb日志写入停滞- alert: MysqlInnodbLogWaitsexpr: rate(mysql_global_status_innodb_log_waits[15m]) > 10for: 0mlabels:severity: warningannotations:summary: MySQL InnoDB log  等待 (实例:  {{ $labels.instance }})description: "MySQL innodb日志正在以 {{ $value }}/秒的速率等待写入磁盘\n  标签:{{ $labels }}"# 实例 `{{ $labels.instance }}` 上的MySQL刚刚在一分钟内重启过。- alert: MysqlRestartedexpr: mysql_global_status_uptime < 60for: 0mlabels:severity: infoannotations:summary: MySQL restarted (实例: {{ $labels.instance }})description: "MySQL 实例 {{ $labels.instance }} 1 分钟内刚刚重启.\n  当前值:{{ $value }}\n  标签:{{ $labels }}"
4 redis rule
4.1 Redis down
Redis instance is down
- alert: RedisDownexpr: redis_up == 0for: 0mlabels:severity: criticalannotations:summary: Redis down (instance {{ $labels.instance }})description: "Redis instance is down\n VALUE = {{ $value }}\n LABELS = {{ $labels }}"
4.2 Redis missing master
Redis cluster has no node marked as master.
- alert: RedisMissingMasterexpr: (count(redis_instance_info{role="master"}) or vector(0)) < 1for: 0mlabels:severity: criticalannotations:summary: Redis missing master (instance {{ $labels.instance }})description: "Redis cluster has no node marked as master.\n VALUE = {{ $value }}\n LABELS = {{ $labels }}"
4.3 Redis too many masters
Redis cluster has too many nodes marked as master.
如果是 cluster 模式,修改 (> 1) 为正确的 master 数量,比如正常是 3 个master ,那就修改为: (> 3)
- alert: RedisTooManyMastersexpr: count(redis_instance_info{role="master"}) > 1for: 0mlabels:severity: criticalannotations:summary: Redis too many masters (instance {{ $labels.instance }})description: "Redis cluster has too many nodes marked as master.\n VALUE = {{ $value }}\n LABELS = {{ $labels }}"
4.4 Redis disconnected slaves
Redis没有为所有从属服务器进行复制。请考虑查看redis复制状态。
- alert: RedisDisconnectedSlavesexpr: count without (instance, job) (redis_connected_slaves) - sum without (instance, job) (redis_connected_slaves) - 1 > 0for: 0mlabels:severity: criticalannotations:summary: Redis disconnected slaves (instance {{ $labels.instance }})description: "Redis not replicating for all slaves. Consider reviewing the redis replication status.\n VALUE = {{ $value }}\n LABELS = {{ $labels }}"
4.5 Redis replication broken Redis 复制已中断
Redis实例丢失一个slave
- alert: RedisReplicationBrokenexpr: delta(redis_connected_slaves[1m]) < 0for: 0mlabels:severity: criticalannotations:summary: Redis replication broken (instance {{ $labels.instance }})description: "Redis instance lost a slave\n VALUE = {{ $value }}\n LABELS = {{ $labels }}"
4.6 Redis cluster flapping Redis群集摆动
Changes have been detected in Redis replica connection. This can occur when replica nodes lose connection to the master and reconnect (a.k.a flapping).
在Redis副本连接中检测到更改。当副本节点失去与主节点的连接并重新连接(也称为摆动)时,可能会发生这种情况。
- alert: RedisClusterFlappingexpr: changes(redis_connected_slaves[1m]) > 1for: 2mlabels:severity: criticalannotations:summary: Redis cluster flapping (instance {{ $labels.instance }})description: "Changes have been detected in Redis replica connection. This can occur when replica nodes lose connection to the master and reconnect (a.k.a flapping).\n VALUE = {{ $value }}\n LABELS = {{ $labels }}"
4.7 Redis missing backup
Redis has not been backuped for 24 hours
Redis已24小时未备份
- alert: RedisMissingBackupexpr: time() - redis_rdb_last_save_timestamp_seconds > 60 * 60 * 24for: 0mlabels:severity: criticalannotations:summary: Redis missing backup (instance {{ $labels.instance }})description: "Redis has not been backuped for 24 hours\n VALUE = {{ $value }}\n LABELS = {{ $labels }}"
4.8 Redis out of system memory
Redis is running out of system memory (> 90%)
The exporter must be started with --include-system-metrics flag or REDIS_EXPORTER_INCL_SYSTEM_METRICS=true environment variable.
- alert: RedisOutOfSystemMemoryexpr: redis_memory_used_bytes / redis_total_system_memory_bytes * 100 > 90for: 2mlabels:severity: warningannotations:summary: Redis out of system memory (instance {{ $labels.instance }})description: "Redis is running out of system memory (> 90%)\n VALUE = {{ $value }}\n LABELS = {{ $labels }}"
4.9 Redis out of configured maxmemory
Redis is running out of configured maxmemory (> 90%)
- alert: RedisOutOfConfiguredMaxmemoryexpr: redis_memory_used_bytes / redis_memory_max_bytes * 100 > 90for: 2mlabels:severity: warningannotations:summary: Redis out of configured maxmemory (instance {{ $labels.instance }})description: "Redis is running out of configured maxmemory (> 90%)\n VALUE = {{ $value }}\n LABELS = {{ $labels }}"
4.10 Redis too many connections
Redis is running out of connections (> 90% used)
- alert: RedisTooManyConnectionsexpr: redis_connected_clients / redis_config_maxclients * 100 > 90for: 2mlabels:severity: warningannotations:summary: Redis too many connections (instance {{ $labels.instance }})description: "Redis is running out of connections (> 90% used)\n VALUE = {{ $value }}\n LABELS = {{ $labels }}"
4.11 Redis not enough connections
Redis(> 5)
- alert: RedisNotEnoughConnectionsexpr: redis_connected_clients < 5for: 2mlabels:severity: warningannotations:summary: Redis not enough connections (instance {{ $labels.instance }})description: "Redis instance should have more connections (> 5)\n VALUE = {{ $value }}\n LABELS = {{ $labels }}"
4.12 Redis rejected connections
Some connections to Redis has been rejected某些到Redis的连接已被拒绝
- alert: RedisRejectedConnectionsexpr: increase(redis_rejected_connections_total[1m]) > 0for: 0mlabels:severity: criticalannotations:summary: Redis rejected connections (instance {{ $labels.instance }})description: "Some connections to Redis has been rejected\n VALUE = {{ $value }}\n LABELS = {{ $labels }}"
4.13 完整规则文件
点击下载
5 rabbitmq rule rabbitmq/rabbitmq-prometheus
此规则是基于 RabbitMQ 官方提供的 RabbitMQ 自身插件
5.1 Rabbitmq node down
- alert: RabbitmqNodeDownexpr: sum(rabbitmq_build_info) < 3for: 0mlabels:severity: criticalannotations:summary: Rabbitmq node down (instance {{ $labels.instance }})description: "RabbitMQ cluster 当前节点数量少于 3 个\n VALUE = {{ $value }}\n LABELS = {{ $labels }}"
5.2 Rabbitmq node not distributed
Distribution link state is not ‘up’
- alert: RabbitmqNodeNotDistributedexpr: erlang_vm_dist_node_state < 3for: 0mlabels:severity: criticalannotations:summary: Rabbitmq node not distributed (instance {{ $labels.instance }})description: "Erlang 部分节点状态异常\n 当前值: {{ $value }}\n 标签: {{ $labels }}"
5.3 Rabbitmq instances different versions
Running different version of Rabbitmq in the same cluster, can lead to failure.
- alert: RabbitmqInstancesDifferentVersionsexpr: count(count(rabbitmq_build_info) by (rabbitmq_version)) > 1for: 1hlabels:severity: warningannotations:summary: Rabbitmq instances different versions (instance {{ $labels.instance }})description: "R在同一个集群中运行不同版本的Rabbitmq可能会导致故障。\n 当前值: {{ $value }}\n 标签: {{ $labels }}"
5.4 Rabbitmq memory high
A node use more than 90% of allocated RAM
- alert: RabbitmqMemoryHighexpr: rabbitmq_process_resident_memory_bytes / rabbitmq_resident_memory_limit_bytes * 100 > 90for: 2mlabels:severity: warningannotations:summary: Rabbitmq memory high (instance {{ $labels.instance }})description: "此节点使用的内存达到给其分配的 90%以上\n 当前值: {{ $value }}\n 标签: {{ $labels }}"
5.5 Rabbitmq file descriptors usage
A node use more than 90% of file descriptors
- alert: RabbitmqFileDescriptorsUsageexpr: rabbitmq_process_open_fds / rabbitmq_process_max_fds * 100 > 90for: 2mlabels:severity: warningannotations:summary: Rabbitmq file descriptors usage (instance {{ $labels.instance }})description: "这个节点使用的文件描述符超过了给其分配的 90% 了\n 当前值: {{ $value }}\n 标签: {{ $labels }}"
5.6 Rabbitmq too many unack messages
Too many unacknowledged messages
- alert: RabbitmqTooManyUnackMessagesexpr: sum(rabbitmq_queue_messages_unacked) BY (queue) > 1000for: 1mlabels:severity: warningannotations:summary: Rabbitmq too many unack messages (instance {{ $labels.instance }})description: "此节点未确认的消息太多了 \n 当前值: {{ $value }}\n 标签: {{ $labels }}"
5.7 Rabbitmq too many connections
The total connections of a node is too high
- alert: RabbitmqTooManyConnectionsexpr: rabbitmq_connections > 1000for: 2mlabels:severity: warningannotations:summary: Rabbitmq too many connections (instance {{ $labels.instance }})description: "节点的总连接数过高\n 当前值: {{ $value }}\n 标签: {{ $labels }}"
5.8 Rabbitmq no queue consumer
A queue has less than 1 consumer
- alert: RabbitmqNoQueueConsumerexpr: rabbitmq_queue_consumers < 1for: 1mlabels:severity: warningannotations:summary: Rabbitmq no queue consumer (instance {{ $labels.instance }})description: "队列的使用者少于1个\n 当前值: {{ $value }}\n 标签: {{ $labels }}"
5.9 Rabbitmq unroutable messages
- alert: RabbitmqUnroutableMessagesexpr: increase(rabbitmq_channel_messages_unroutable_returned_total[1m]) > 0 or increase(rabbitmq_channel_messages_unroutable_dropped_total[1m]) > 0for: 2mlabels:severity: warningannotations:summary: Rabbitmq unroutable messages (instance {{ $labels.instance }})description: "队列包含不可路由的消息\n 当前值: {{ $value }}\n 标签: {{ $labels }}"
6 minio rule
7 postgresql
7.1 Postgresql down
Postgresql instance is down
- alert: PostgresqlDownexpr: pg_up == 0for: 0mlabels:severity: criticalannotations:summary: Postgresql down (instance {{ $labels.instance }})description: "Postgresql instance is down\n VALUE = {{ $value }}\n LABELS = {{ $labels }}"
7.2 Postgresql restarted
Postgresql restarted
此指标没有
- alert: PostgresqlRestartedexpr: time() - pg_postmaster_start_time_seconds < 60for: 0mlabels:severity: criticalannotations:summary: Postgresql restarted (instance {{ $labels.instance }})description: "Postgresql restarted\n VALUE = {{ $value }}\n LABELS = {{ $labels }}"
7.3 Postgresql exporter error
Postgresql exporter is showing errors. A query may be buggy in query.yaml
- alert: PostgresqlExporterErrorexpr: pg_exporter_last_scrape_error > 0for: 0mlabels:severity: criticalannotations:summary: Postgresql exporter error (instance {{ $labels.instance }})description: "Postgresql exporter is showing errors. A query may be buggy in query.yaml\n VALUE = {{ $value }}\n LABELS = {{ $labels }}"
7.4 Postgresql table not auto vacuumed
Table {{ $labels.relname }} has not been auto vacuumed for 10 days
此指标没有
- alert: PostgresqlTableNotAutoVacuumedexpr: (pg_stat_user_tables_last_autovacuum > 0) and (time() - pg_stat_user_tables_last_autovacuum) > 60 * 60 * 24 * 10for: 0mlabels:severity: warningannotations:summary: Postgresql table not auto vacuumed (instance {{ $labels.instance }})description: "Table {{ $labels.relname }} has not been auto vacuumed for 10 days\n VALUE = {{ $value }}\n LABELS = {{ $labels }}"
7.5 Postgresql table not auto analyzed
Table {{ $labels.relname }} has not been auto analyzed for 10 days
此指标没有
- alert: PostgresqlTableNotAutoAnalyzedexpr: (pg_stat_user_tables_last_autoanalyze > 0) and (time() - pg_stat_user_tables_last_autoanalyze) > 24 * 60 * 60 * 10for: 0mlabels:severity: warningannotations:summary: Postgresql table not auto analyzed (instance {{ $labels.instance }})description: "Table {{ $labels.relname }} has not been auto analyzed for 10 days\n VALUE = {{ $value }}\n LABELS = {{ $labels }}"
7.6 Postgresql too many connections
PostgreSQL instance has too many connections (> 80%).
需要在配置文件中设置最大连接数
- alert: PostgresqlTooManyConnectionsexpr: sum by (instance, job, server) (pg_stat_activity_count) > min by (instance, job, server) (pg_settings_max_connections * 0.8)for: 2mlabels:severity: warningannotations:summary: Postgresql too many connections (instance {{ $labels.instance }})description: "PostgreSQL instance has too many connections (> 80%).\n VALUE = {{ $value }}\n LABELS = {{ $labels }}"
7.7 Postgresql not enough connections
PostgreSQL实例当前连接数过少 (< 5)
- alert: PostgresqlNotEnoughConnectionsexpr: sum by (datname) (pg_stat_activity_count{datname!~"template.*|postgres"}) < 5for: 2mlabels:severity: warningannotations:summary: Postgresql not enough connections (instance {{ $labels.instance }})description: "PostgreSQL instance should have more connections (> 5)\n VALUE = {{ $value }}\n LABELS = {{ $labels }}"
7.8 Postgresql dead locks
PostgreSQL has dead-locks
- alert: PostgresqlDeadLocksexpr: increase(pg_stat_database_deadlocks{datname!~"template.*|postgres"}[1m]) > 5for: 0mlabels:severity: warningannotations:summary: Postgresql dead locks (instance {{ $labels.instance }})description: "PostgreSQL has dead-locks\n VALUE = {{ $value }}\n LABELS = {{ $labels }}"
7.9 Postgresql high rollback rate
Ratio of transactions being aborted compared to committed is > 2 %
- alert: PostgresqlHighRollbackRateexpr: sum by (namespace,datname) ((rate(pg_stat_database_xact_rollback{datname!~"template.*|postgres",datid!="0"}[3m])) / ((rate(pg_stat_database_xact_rollback{datname!~"template.*|postgres",datid!="0"}[3m])) + (rate(pg_stat_database_xact_commit{datname!~"template.*|postgres",datid!="0"}[3m])))) > 0.02for: 0mlabels:severity: warningannotations:summary: Postgresql high rollback rate (instance {{ $labels.instance }})description: "Ratio of transactions being aborted compared to committed is > 2 %\n VALUE = {{ $value }}\n LABELS = {{ $labels }}"
7.10 Postgresql commit rate low
Postgresql seems to be processing very few transactions
- alert: PostgresqlCommitRateLowexpr: rate(pg_stat_database_xact_commit[1m]) < 10for: 2mlabels:severity: criticalannotations:summary: Postgresql commit rate low (instance {{ $labels.instance }})description: "Postgresql seems to be processing very few transactions\n VALUE = {{ $value }}\n LABELS = {{ $labels }}"
7.11 Postgresql low XID consumption
Postgresql seems to be consuming transaction IDs very slowly
此指标没有
- alert: PostgresqlLowXidConsumptionexpr: rate(pg_txid_current[1m]) < 5for: 2mlabels:severity: warningannotations:summary: Postgresql low XID consumption (instance {{ $labels.instance }})description: "Postgresql seems to be consuming transaction IDs very slowly\n VALUE = {{ $value }}\n LABELS = {{ $labels }}"
7.12 Postgresql high rate statement timeout
Postgres transactions showing high rate of statement timeouts
此指标没有
- alert: PostgresqlHighRateStatementTimeoutexpr: rate(postgresql_errors_total{type="statement_timeout"}[1m]) > 3for: 0mlabels:severity: criticalannotations:summary: Postgresql high rate statement timeout (instance {{ $labels.instance }})description: "Postgres transactions showing high rate of statement timeouts\n VALUE = {{ $value }}\n LABELS = {{ $labels }}"
7.13 Postgresql high rate deadlock
Postgres detected deadlocks
此指标没有
- alert: PostgresqlHighRateDeadlockexpr: increase(postgresql_errors_total{type="deadlock_detected"}[1m]) > 1for: 0mlabels:severity: criticalannotations:summary: Postgresql high rate deadlock (instance {{ $labels.instance }})description: "Postgres detected deadlocks\n VALUE = {{ $value }}\n LABELS = {{ $labels }}"
7.14 Postgresql unused replication slot
Unused Replication Slots
此指标没有
- alert: PostgresqlUnusedReplicationSlotexpr: pg_replication_slots_active == 0for: 1mlabels:severity: warningannotations:summary: Postgresql unused replication slot (instance {{ $labels.instance }})description: "Unused Replication Slots\n VALUE = {{ $value }}\n LABELS = {{ $labels }}"
7.15 Postgresql too many dead tuples
PostgreSQL dead tuples is too large
没有
- alert: PostgresqlTooManyDeadTuplesexpr: ((pg_stat_user_tables_n_dead_tup > 10000) / (pg_stat_user_tables_n_live_tup + pg_stat_user_tables_n_dead_tup)) >= 0.1for: 2mlabels:severity: warningannotations:summary: Postgresql too many dead tuples (instance {{ $labels.instance }})description: "PostgreSQL dead tuples is too large\n VALUE = {{ $value }}\n LABELS = {{ $labels }}"
7.16 Postgresql SSL compression active
启用SSL压缩的数据库连接。这可能会在复制延迟中增加显著的抖动。副本应通过“recovery.conf”中的 sslcompression=0 关闭SSL压缩。
- alert: PostgresqlSslCompressionActiveexpr: sum(pg_stat_ssl_compression) > 0for: 0mlabels:severity: criticalannotations:summary: Postgresql SSL compression active (instance {{ $labels.instance }})description: "Database connections with SSL compression enabled. This may add significant jitter in replication delay. Replicas should turn off SSL compression via `sslcompression=0` in `recovery.conf`.\n VALUE = {{ $value }}\n LABELS = {{ $labels }}"
7.17 Postgresql too many locks acquired
在数据库上获取的锁太多。如果此警报频繁发生,我们可能需要增加postgres设置 max_locks_per_transaction。
需要在 settings 配置文件中设置
- alert: PostgresqlTooManyLocksAcquiredexpr: ((sum (pg_locks_count)) / (pg_settings_max_locks_per_transaction * pg_settings_max_connections)) > 0.20for: 2mlabels:severity: criticalannotations:summary: Postgresql too many locks acquired (instance {{ $labels.instance }})description: "Too many locks acquired on the database. If this alert happens frequently, we may need to increase the postgres setting max_locks_per_transaction.\n VALUE = {{ $value }}\n LABELS = {{ $labels }}"
7.18 Postgresql bloat index high (> 80%)
The index {{ $labels.idxname }} is bloated. You should execute REINDEX INDEX CONCURRENTLY {{ $labels.idxname }};
See https://github.com/samber/awesome-prometheus-alerts/issues/289#issuecomment-1164842737
没有
- alert: PostgresqlBloatIndexHigh(>80%)expr: pg_bloat_btree_bloat_pct > 80 and on (idxname) (pg_bloat_btree_real_size > 100000000)for: 1hlabels:severity: warningannotations:summary: Postgresql bloat index high (> 80%) (instance {{ $labels.instance }})description: "The index {{ $labels.idxname }} is bloated. You should execute `REINDEX INDEX CONCURRENTLY {{ $labels.idxname }};`\n VALUE = {{ $value }}\n LABELS = {{ $labels }}"
7.19 Postgresql bloat table high (> 80%)
The table {{ $labels.relname }} is bloated. You should execute VACUUM {{ $labels.relname }};
See https://github.com/samber/awesome-prometheus-alerts/issues/289#issuecomment-1164842737
没有
- alert: PostgresqlBloatTableHigh(>80%)expr: pg_bloat_table_bloat_pct > 80 and on (relname) (pg_bloat_table_real_size > 200000000)for: 1hlabels:severity: warningannotations:summary: Postgresql bloat table high (> 80%) (instance {{ $labels.instance }})description: "The table {{ $labels.relname }} is bloated. You should execute `VACUUM {{ $labels.relname }};`\n VALUE = {{ $value }}\n LABELS = {{ $labels }}"
7.20 完整规则
groups:
- name: "PostgresqlAlert"rules:- alert: PostgresqlDownexpr: pg_up == 0for: 0mlabels:severity: criticalannotations:summary: Postgresql down (instance {{ $labels.instance }})description: "Postgresql instance is down\n  VALUE = {{ $value }}\n  LABELS = {{ $labels }}"- alert: PostgresqlRestartedexpr: time() - pg_postmaster_start_time_seconds < 60for: 0mlabels:severity: criticalannotations:summary: Postgresql restarted (instance {{ $labels.instance }})description: "Postgresql restarted\n  VALUE = {{ $value }}\n  LABELS = {{ $labels }}"- alert: PostgresqlExporterErrorexpr: pg_exporter_last_scrape_error > 0for: 0mlabels:severity: criticalannotations:summary: Postgresql exporter error (instance {{ $labels.instance }})description: "Postgresql exporter is showing errors. A query may be buggy in query.yaml\n  VALUE = {{ $value }}\n  LABELS = {{ $labels }}"- alert: PostgresqlTableNotAutoVacuumedexpr: (pg_stat_user_tables_last_autovacuum > 0) and (time() - pg_stat_user_tables_last_autovacuum) > 60 * 60 * 24 * 10for: 0mlabels:severity: warningannotations:summary: Postgresql table not auto vacuumed (instance {{ $labels.instance }})description: "Table {{ $labels.relname }} has not been auto vacuumed for 10 days\n  VALUE = {{ $value }}\n  LABELS = {{ $labels }}"- alert: PostgresqlTableNotAutoAnalyzedexpr: (pg_stat_user_tables_last_autoanalyze > 0) and (time() - pg_stat_user_tables_last_autoanalyze) > 24 * 60 * 60 * 10for: 0mlabels:severity: warningannotations:summary: Postgresql table not auto analyzed (instance {{ $labels.instance }})description: "Table {{ $labels.relname }} has not been auto analyzed for 10 days\n  VALUE = {{ $value }}\n  LABELS = {{ $labels }}"- alert: PostgresqlTooManyConnectionsexpr: sum by (instance, job, server) (pg_stat_activity_count) > min by (instance, job, server) (pg_settings_max_connections * 0.8)for: 2mlabels:severity: warningannotations:summary: Postgresql too many connections (instance {{ $labels.instance }})description: "PostgreSQL instance has too many connections (> 80%).\n  VALUE = {{ $value }}\n  LABELS = {{ $labels }}"- alert: PostgresqlNotEnoughConnectionsexpr: sum by (datname) (pg_stat_activity_count{datname!~"template.*|postgres"}) < 5for: 2mlabels:severity: warningannotations:summary: Postgresql not enough connections (instance {{ $labels.instance }})description: "PostgreSQL instance should have more connections (> 5)\n  VALUE = {{ $value }}\n  LABELS = {{ $labels }}"- alert: PostgresqlDeadLocksexpr: increase(pg_stat_database_deadlocks{datname!~"template.*|postgres"}[1m]) > 5for: 0mlabels:severity: warningannotations:summary: Postgresql dead locks (instance {{ $labels.instance }})description: "PostgreSQL has dead-locks\n  VALUE = {{ $value }}\n  LABELS = {{ $labels }}"- alert: PostgresqlHighRollbackRateexpr: sum by (namespace,datname) ((rate(pg_stat_database_xact_rollback{datname!~"template.*|postgres",datid!="0"}[3m])) / ((rate(pg_stat_database_xact_rollback{datname!~"template.*|postgres",datid!="0"}[3m])) + (rate(pg_stat_database_xact_commit{datname!~"template.*|postgres",datid!="0"}[3m])))) > 0.02for: 0mlabels:severity: warningannotations:summary: Postgresql high rollback rate (instance {{ $labels.instance }})description: "Ratio of transactions being aborted compared to committed is > 2 %\n  VALUE = {{ $value }}\n  LABELS = {{ $labels }}"- alert: PostgresqlCommitRateLowexpr: rate(pg_stat_database_xact_commit[1m]) < 10for: 2mlabels:severity: criticalannotations:summary: Postgresql commit rate low (instance {{ $labels.instance }})description: "Postgresql seems to be processing very few transactions\n  VALUE = {{ $value }}\n  LABELS = {{ $labels }}"- alert: PostgresqlLowXidConsumptionexpr: rate(pg_txid_current[1m]) < 5for: 2mlabels:severity: warningannotations:summary: Postgresql low XID consumption (instance {{ $labels.instance }})description: "Postgresql seems to be consuming transaction IDs very slowly\n  VALUE = {{ $value }}\n  LABELS = {{ $labels }}"- alert: PostgresqlHighRateStatementTimeoutexpr: rate(postgresql_errors_total{type="statement_timeout"}[1m]) > 3for: 0mlabels:severity: criticalannotations:summary: Postgresql high rate statement timeout (instance {{ $labels.instance }})description: "Postgres transactions showing high rate of statement timeouts\n  VALUE = {{ $value }}\n  LABELS = {{ $labels }}"- alert: PostgresqlHighRateDeadlockexpr: increase(postgresql_errors_total{type="deadlock_detected"}[1m]) > 1for: 0mlabels:severity: criticalannotations:summary: Postgresql high rate deadlock (instance {{ $labels.instance }})description: "Postgres detected deadlocks\n  VALUE = {{ $value }}\n  LABELS = {{ $labels }}"- alert: PostgresqlUnusedReplicationSlotexpr: pg_replication_slots_active == 0for: 1mlabels:severity: warningannotations:summary: Postgresql unused replication slot (instance {{ $labels.instance }})description: "Unused Replication Slots\n  VALUE = {{ $value }}\n  LABELS = {{ $labels }}"- alert: PostgresqlTooManyDeadTuplesexpr: ((pg_stat_user_tables_n_dead_tup > 10000) / (pg_stat_user_tables_n_live_tup + pg_stat_user_tables_n_dead_tup)) >= 0.1for: 2mlabels:severity: warningannotations:summary: Postgresql too many dead tuples (instance {{ $labels.instance }})description: "PostgreSQL dead tuples is too large\n  VALUE = {{ $value }}\n  LABELS = {{ $labels }}"- alert: PostgresqlConfigurationChangedexpr: {__name__=~"pg_settings_.*"} != ON(__name__) {__name__=~"pg_settings_([^t]|t[^r]|tr[^a]|tra[^n]|tran[^s]|trans[^a]|transa[^c]|transac[^t]|transact[^i]|transacti[^o]|transactio[^n]|transaction[^_]|transaction_[^r]|transaction_r[^e]|transaction_re[^a]|transaction_rea[^d]|transaction_read[^_]|transaction_read_[^o]|transaction_read_o[^n]|transaction_read_on[^l]|transaction_read_onl[^y]).*"} OFFSET 5mfor: 0mlabels:severity: infoannotations:summary: Postgresql configuration changed (instance {{ $labels.instance }})description: "Postgres Database configuration change has occurred\n  VALUE = {{ $value }}\n  LABELS = {{ $labels }}"- alert: PostgresqlSslCompressionActiveexpr: sum(pg_stat_ssl_compression) > 0for: 0mlabels:severity: criticalannotations:summary: Postgresql SSL compression active (instance {{ $labels.instance }})description: "Database connections with SSL compression enabled. This may add significant jitter in replication delay. Replicas should turn off SSL compression via `sslcompression=0` in `recovery.conf`.\n  VALUE = {{ $value }}\n  LABELS = {{ $labels }}"- alert: PostgresqlTooManyLocksAcquiredexpr: ((sum (pg_locks_count)) / (pg_settings_max_locks_per_transaction * pg_settings_max_connections)) > 0.20for: 2mlabels:severity: criticalannotations:summary: Postgresql too many locks acquired (instance {{ $labels.instance }})description: "Too many locks acquired on the database. If this alert happens frequently, we may need to increase the postgres setting max_locks_per_transaction.\n  VALUE = {{ $value }}\n  LABELS = {{ $labels }}"- alert: PostgresqlBloatIndexHigh(>80%)expr: pg_bloat_btree_bloat_pct > 80 and on (idxname) (pg_bloat_btree_real_size > 100000000)for: 1hlabels:severity: warningannotations:summary: Postgresql bloat index high (> 80%) (instance {{ $labels.instance }})description: "The index {{ $labels.idxname }} is bloated. You should execute `REINDEX INDEX CONCURRENTLY {{ $labels.idxname }};`\n  VALUE = {{ $value }}\n  LABELS = {{ $labels }}"- alert: PostgresqlBloatTableHigh(>80%)expr: pg_bloat_table_bloat_pct > 80 and on (relname) (pg_bloat_table_real_size > 200000000)for: 1hlabels:severity: warningannotations:summary: Postgresql bloat table high (> 80%) (instance {{ $labels.instance }})description: "The table {{ $labels.relname }} is bloated. You should execute `VACUUM {{ $labels.relname }};`\n  VALUE = {{ $value }}\n  LABELS = {{ $labels }}"
8 kafka rule
9 keepalived rule
参考 https://samber.github.io/awesome-prometheus-alerts/